Burndown Chart
Summary of Burndown Chart
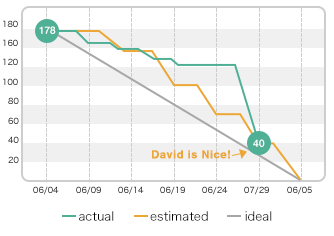
Burndown Chart answers your question, "Can all tasks be completed by the due date?" at a glance. Burndown Chart plots "the amount of tasks" vertically and "time" horizontally and shows tasks left to do versus time. As time pass, the outstanding tasks decreases. The lines in the graph lean from top to bottom and from left to right. There are 3 lines in the Burndown Chart.
 : This line shows the actual result of the progress and the currently outstanding tasks. The "estimated hours" will decrease as tasks are completed.
 : This line shows the estimated progress. It is calculated from "Due Date" and "Estimated Hours". Actual Line overlaps Estimated Line when the tasks are completed as planned.
 : This line is drawn by averaging the amount of tasks by the number of days. This line can be used to verify if the plan is appropriate.
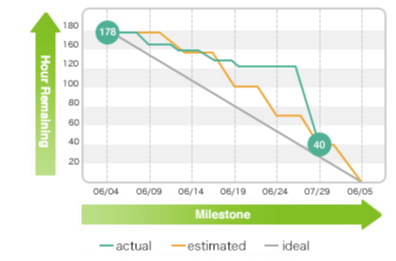
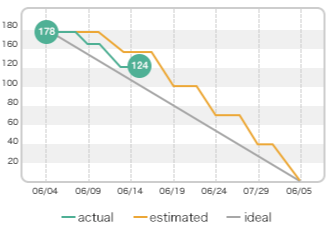
When the project is progressing as estimated
When the project is progressing as estimated, Actual Line is displayed below Estimated Line.
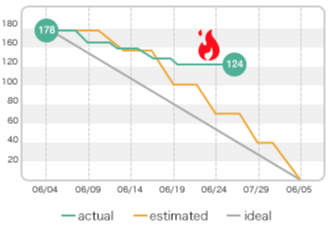
When the project is not progressing as estimated
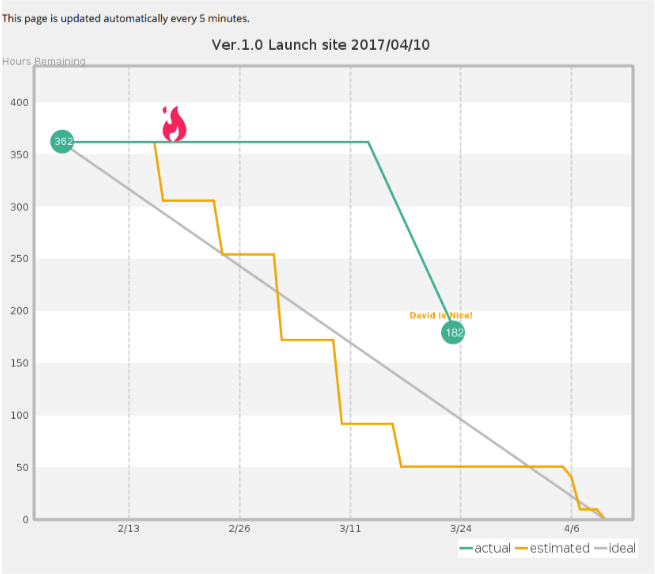
When the project is not progressing as estimated, Actual Line is displayed above Estimated Line. When the progress is way behind the plan, Backlog will put a flame icon.
When the project progressed drastically
When the project progressed drastically, Backlog will show a praising message to the most contributing member.
Change Project Setting
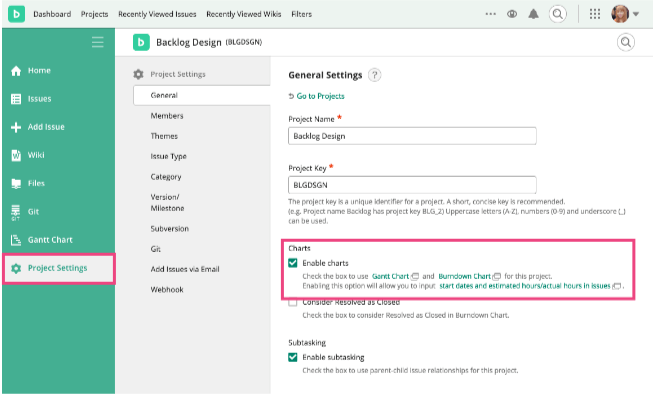
To use Burndown Chart, check "Use Chart" when you create a new project or from Edit Project basic settings page.
Check the "Consider Resolved as Closed" box to consider Resolved as Closed in Burndown Chart.
Set Span
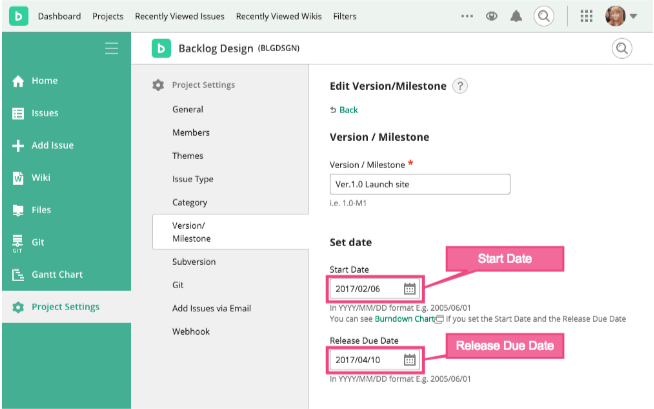
The span of Burndown Charts depends on milestones. On milestone settings, set "Start Date" and "Release Due Date (Finish Date)". Long spans tend to cause delay in changing plans. The ideal span is around 1 week to 1.5 months. When the span is set, currently active milestone's Burndown Chart will be displayed on Project Home.
Add Information to Issue
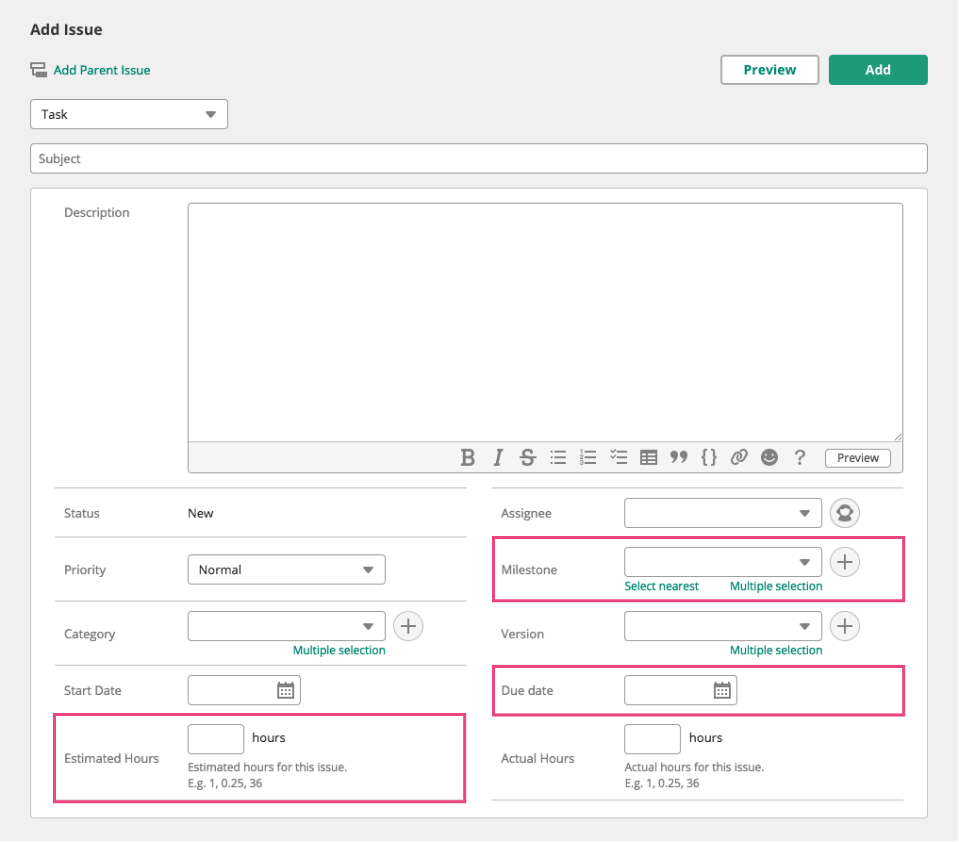
When new issues are added with "Milestone", "Due Date" and "Estimated Hours", the data will be added to Estimated Line. If the "Estimated Hours" is left blank, it will be calculated as 1 hour. To create an accurate Burndown Chart, please enter "Estimated Hours" whenever possible. Actual Line declines as much as "Estimated Hours" when an issue is completed.
Show Burndown Chart and Visualize Current Status of Project
Burndown Chart on Project Home can be expanded when it's clicked. The charts on full screen page are updated automatically every 5 minutes. Displaying this page of Burndown Charts on an exclusive monitor at where all members can see any time, helps to visualize the current status of the project.