Gantt Chart
Summary of Gantt Chart
Gantt Chart illustrates schedules and task plans with vertical bars. It makes easy to know when each issues and tasks starts and ends. On Backlog, Gantt Charts can be displayed with a few pieces of information. You only need to set one of start date, due date, milestone, or finish date (automatic).

How to use Gantt Chart
To use Gantt Chart, check "Enable Chart" when you create a new project or from Project Settings page.

How to show issue in Gantt Chart
To display issues on Gantt Chart One of start date, due date, milestone, or finish date (automatic) needs to be set.
- The vertical bar will be displayed when start date and due date of the issue are set.
- The bar will be displayed on the start date when only start date of the issue is set.
- The bar will be displayed on the due date when only due date of the issue is set.
- Neither the start date nor due date are set but milestone is set.
- If the milestone has the release date, the bar will be displayed on the release date.
- If the milestone has no release date, the bar will be displayed on the date the issue is completed.
Scroll display and show details of issues
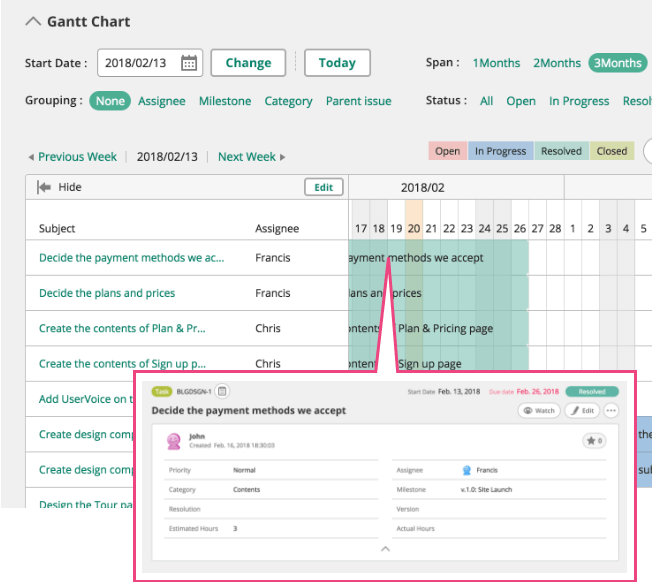
Chart can be scrolled left and right by dragging. Clicking each row will show the details of Issues.

Display Setting
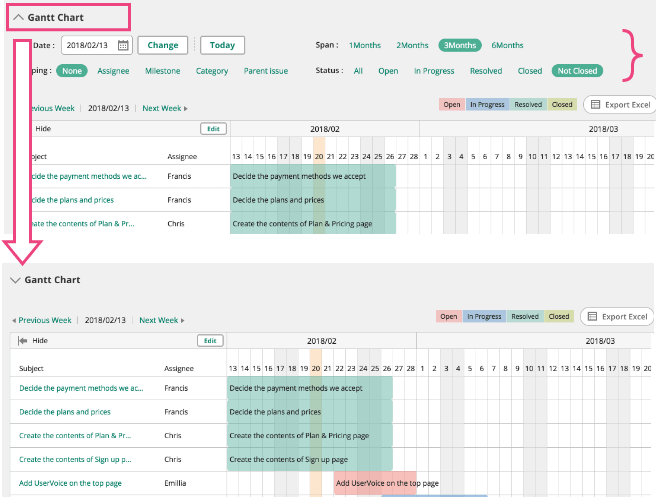
Display of Gantt Chart can be changed. The following 4 settings can be changed:
Displayed Start Date
Set the displayed start date of Gantt Chart Choose the date you want to set as the start date from the calendar and press "Change" button. If you press "Today" button, today will be the start date.
Span
Displayed span of Gantt Chart can be chosen from 1 Month, 2 Months, 3 Months or 6 Months.
Grouping
Issues will be grouped. If you choose "Assignee", the bars on Gantt Chart will be displayed separately by Assignee.
Status
Only the issues with selected status will be displayed.
Setting can be folded down to expand the area for the chart.

Edit
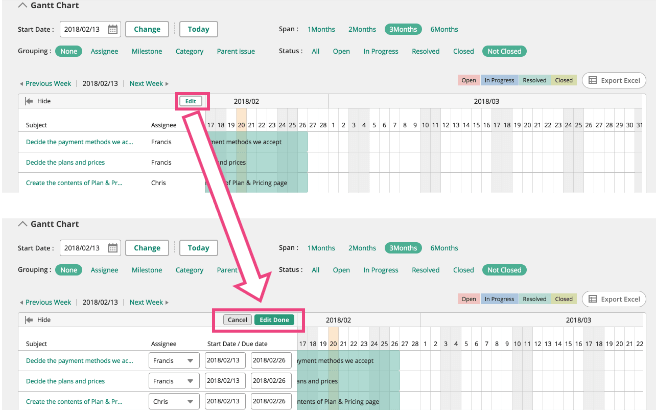
Three attributes of issues can be changed on Gantt Chart by clicking "Edit" tab.
- Assignee
- Start Date
- Due Date
After editing, click "Edit Done" to update the data or click "Cancel" not to update the data.

Export to Excel
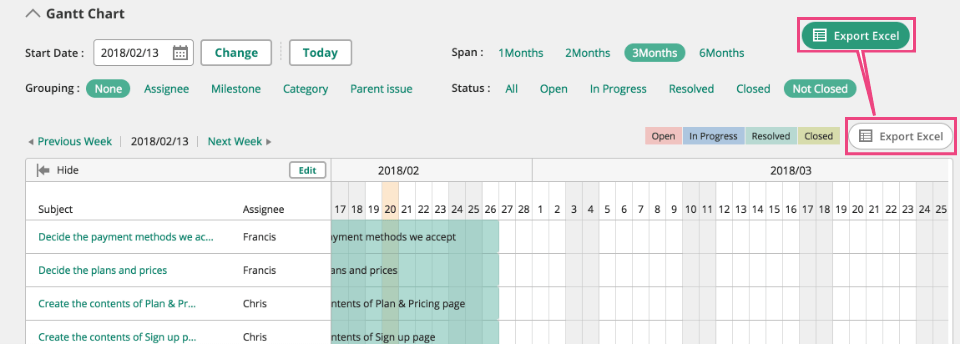
Clicking "Export Excel" on the right of View Settings, the Gantt Chart currently displayed can be downloaded as an Excel file.
