- All templates
- Engineering & Infrastructure
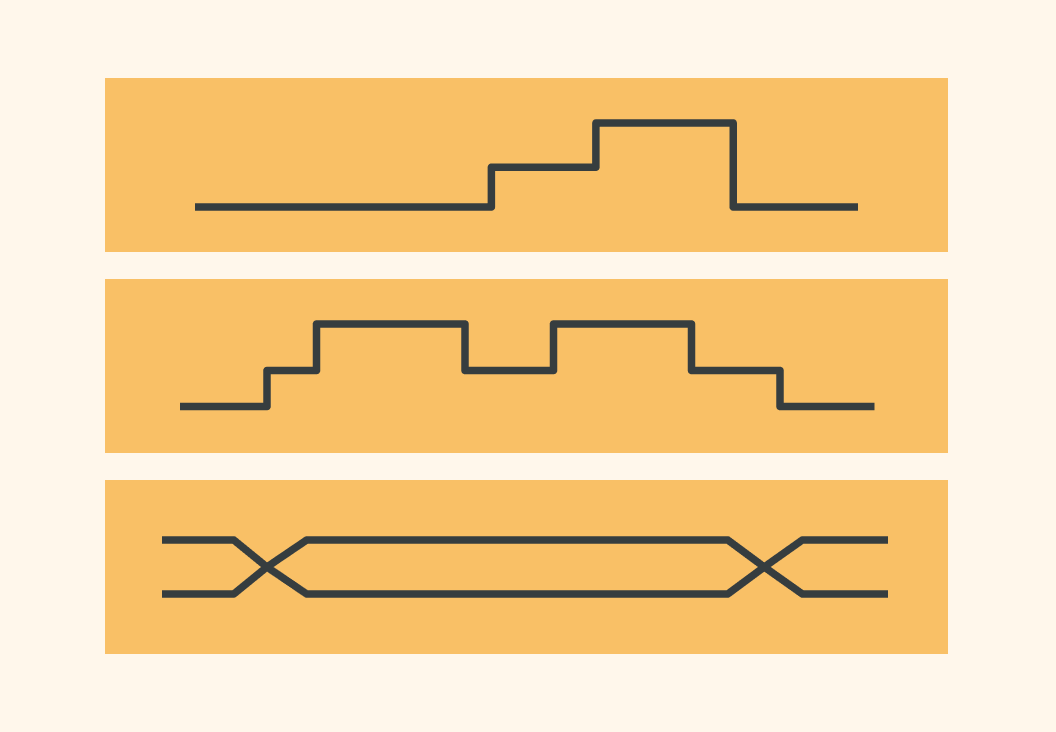
- Timing Diagram
Timing Diagram
Uses of Timing Diagrams
Timing diagrams use time to show the sequence of steps or events in a process or system. By mapping out the steps and how long each one takes, you can identify areas of improvement that can help save time and money.


How to create your Timing Diagram template
Open the timing diagram template in Cacoo.
Determine the process or system you want to diagram.
Think about the key players or steps involved, and add them along the Y (vertical) access.
Add the measurements of time along the X (horizontal) access. This could be seconds, minutes, hours, days, etc.
Plot out the points on the board, and use lines and arrows to show the progress over time. You can treat each step individually, or show how the process moves from step to step.
Add more details using labels and notes.
Analyze the final diagram to see if there are steps taking more time than needed and what can be done to make them more efficient.
Related tags
You may also like


