Introduction to network diagrams
Before you set up a complex network of servers, routers, and firewalls, you should map out your plans with a network diagram.
Visually laying out your network architecture gives you a chance to make sure you’ve thought through every device or component to ensure the entire system works properly. Conversely, should something go wrong in your network later, you can use your diagram to troubleshoot issues.
We created this guide to help you learn how to create useful and informative network diagrams.
This guide is perfect for:
- anyone interested in visualizing a network,
- network engineers and designers learning to create network documentation, and
- people wanting to brush up on the fundamentals of network diagramming.
What is a network diagram?
Network diagrams are used to visually explain computer or telecommunication networks. They show the various components of a network and how they relate to one another.
A network diagram can be as simple as a single application or as complicated as an entire enterprise. And they are used to represent all kinds of networks including home networks, wireless networks, LAN networks, activity networks, and more.
We divide network diagrams into two types: physical and logical.
- Physical network diagrams show the physical layout of the devices that make up a network, similar to a floor plan. This includes cables and hardware.
- Logical network diagrams show how information flows through a network and how devices communicate with each other. This includes subnets, network devices, and routing protocols.
Network diagram uses
Network diagrams are used to show how a large project or task can be broken down into a logical series of subtasks. They provide another way to analyze company projects.
Network diagrams can be used to:
- Plan the structure of a home or office network
- Determine the sequence of tasks that need to be completed for a project
- Update an existing network
- Troubleshoot network bugs or errors
- Comply with requirements
- Act as documentation for internal/external communication, onboarding, planning, etc.
- Track components or devices
- Depict steps taken to implement a project
- Propose network changes to stakeholders
And so much more!
Types of network topologies
There are a few basic arrangements most network diagrams follow. These arrangements, or topologies, can describe either the physical or logical aspects of a network. While the logical and physical topologies of a particular network may resemble one another, they don’t have to. For example, a network that exists as a star topology physically may follow a bus topology logically, as is the case for a twisted pair ethernet network.
Each type of topology has advantages and drawbacks, so it’s important to pick the one that fits your circumstances. The type of topology you choose will affect the performance and stability of your network.
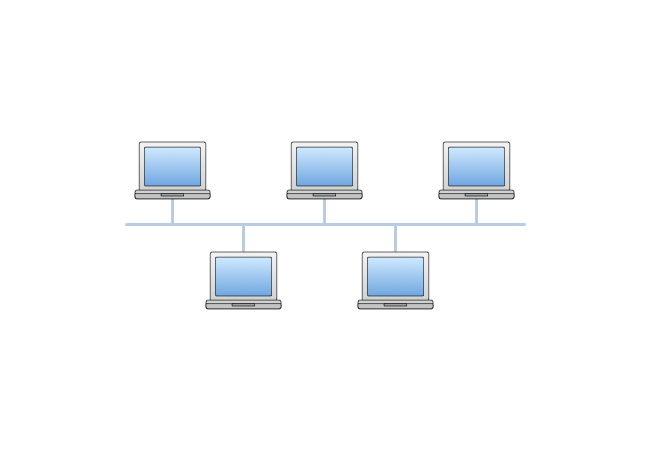
Bus topology
A bus topology is also often referred to as a backbone, linear, or ethernet topology. Nodes are connected to a central “bus” with exactly two endpoints.
Bus topology is easy to configure and requires less cable than any other topology. However, if the central bus breaks down, so does the whole network, making it difficult to identify and troubleshoot the problem.
Ring topology
A ring topology, as you might guess, is made up of nodes connected in the shape of a circle. Information is sent through the circle until it reaches its destination.
Similar to the bus topology, when one node fails, the whole network fails. However, although bandwidth is shared across all the devices and connections, ring networks can outperform bus-based networks. Plus, they are the easiest topology to re-configure, i.e., add or remove devices.

Star topology
Star topologies are among the most common arrangements. All nodes connect to one central hub or switch, through which all information passes.
These topologies are more reliable than either bus or ring topologies because individual nodes can fail without affecting the rest of the network. This also makes it easy to take down any individual node for repair. However, if the central hub fails, the entire network will stall. Plus, cable costs tend to be higher for star networks.

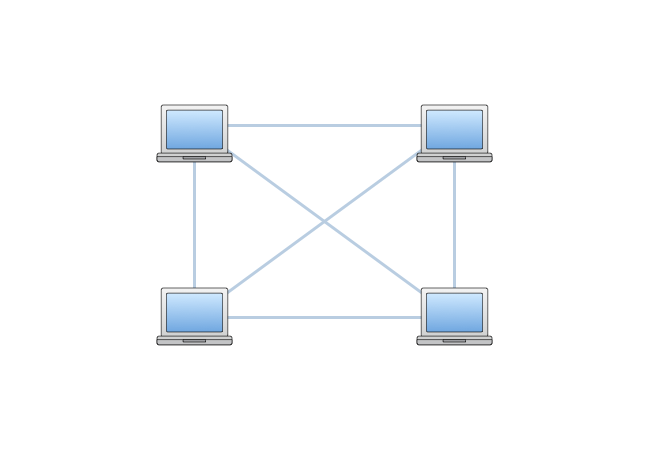
Mesh topology
There are two types of mesh topology: full mesh topology and partial mesh topology. In a full mesh topology, each node is directly connected to every other node. In a partial mesh topology, nodes are only connected to the nodes they interact with most. Each node in this type of network diagram relays data for the network.
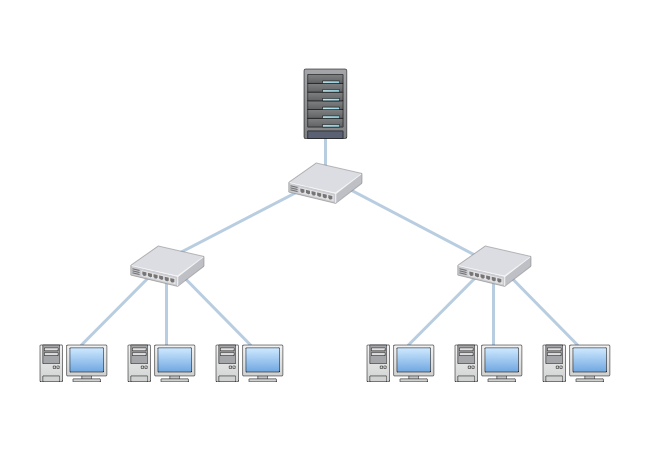
Tree topology
Tree topology is a combination of bus and star topology. Most networks employ some combination of topologies to form a hybrid topology.
Advanced topologies and architectures
As networks grow more complex, a better understanding of advanced topologies and architectures becomes crucial.
Hybrid topology
Hybrid topologies combine two or more different types of topologies, allowing for a more resilient and flexible network architecture. For example, a combination of star and mesh topologies can provide both reliability and enhanced performance.
Cloud-based network diagrams
Given the rise of cloud computing, it’s also important to understand how to represent networks hosted in the cloud, such as those on AWS, GCP, and Microsoft Azure. These diagrams can become quite intricate, representing virtual resources alongside physical ones.
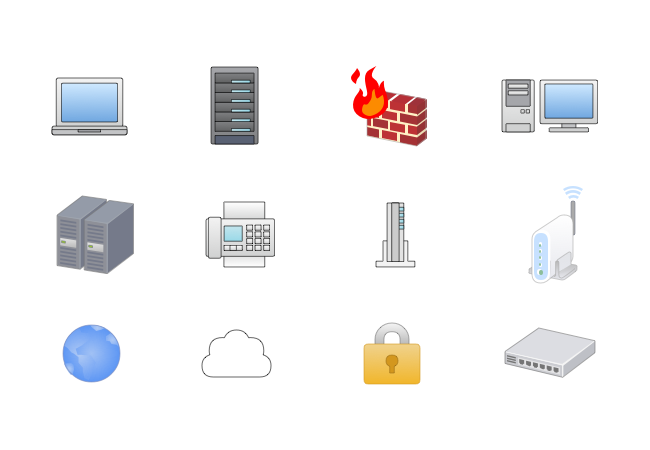
Network diagram symbols
Since a network diagram is a visual representation of an actual system, it relies on symbols that represent both physical entities and the kinds of relationships that exist between entities.
Here are some of the most common symbols:
AWS and GCP symbols
Amazon Web Services and Google Cloud Platform are two of the leading providers of cloud hosting services. Each has its own set of symbols for describing networks hosted on its services.
A few examples of AWS symbols available in Cacoo are:
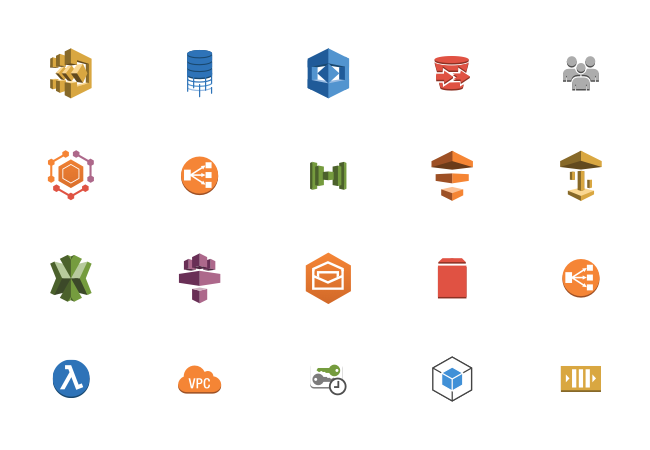
A few examples of GCP symbols available in Cacoo are:

More AWS and GCP icons are available in Cacoo, or you can download them here:
Glossary of terms
Like most kinds of diagrams, there are common terms people use to talk about the relationships between shapes.
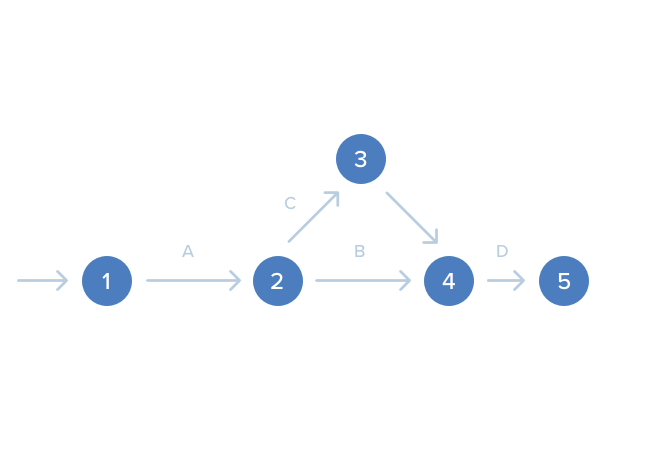
Activities (i.e., operations) are represented by arrows to show direction.
There are four main types of activities:
- Predecessor activities must be completed before the start of another activity.
- Successor activities follow another activity and cannot be initiated until the activities that come before it are complete.
- Concurrent activities start at the same time.
- Dummy activities do not use any resources but depict dependence.
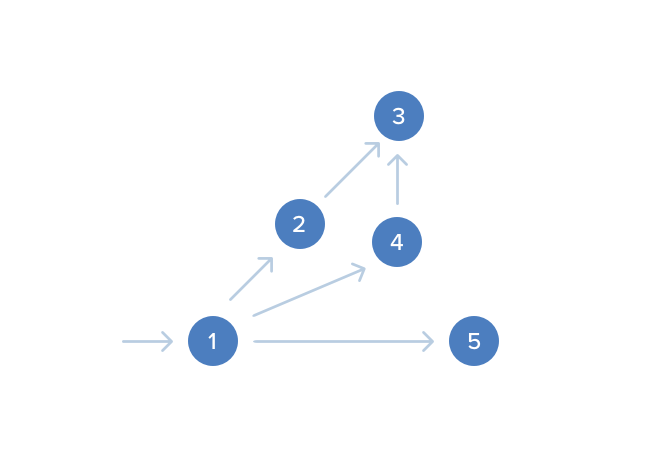
Events, which represent the start and/or completion of one or more activities, are represented by circles called nodes.
There are three main types of events:
- Merge events occur when one or more activities connect with an event.
- Burst events occur when one or more activities leave an event.
- Merge and burst events occur when one or more activities merge and burst simultaneously.
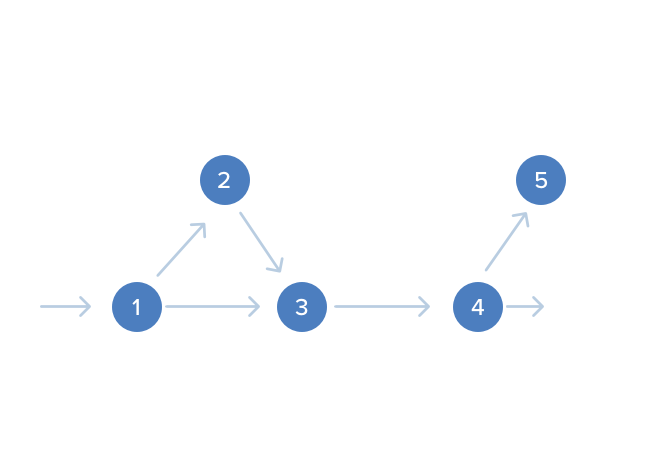
Sequencing refers to how devices or activities act in a series as information is transmitted. Sequencing is used to determine what jobs follow and proceed, what jobs run concurrently, and what controls the start and end of a transmission.
Common network components
- NICs (Network Interface Cards): Essential for allowing a device to connect to the network.
- Switches and Hubs: Fundamental for managing the flow of data.
- Routers and Gateways: Crucial for directing traffic and ensuring connectivity with other networks.
- Firewalls: Important for securing and monitoring traffic.
Network protocols and standards
- TCP/IP: The basic communication language of the internet.
- HTTP/HTTPS: Protocols for transferring web pages.
- FTP/SFTP: For transferring files over a network securely.
- SSL/TLS: Protocols for securing communications over a network.
- VPN: Methods for securely connecting to a private network over a public network.
Network security practices
- Firewalls: Representing different types of firewalls and their positioning in the network.
- Intrusion Detection/Prevention Systems: Icons representing IDS/IPS.
- Virtual Private Networks (VPNs): Showcasing secure remote access.
Troubleshooting and maintenance tips
- Regular Backups: Keep backups of your network diagrams.
- Update Diagrams Frequently: Reflect any changes in your actual network.
- Monitoring Tools: Use tools to monitor network performance and detect issues early.
- Documentation: Maintain detailed documentation for easier troubleshooting.
Real-world use cases
- Use Case 1: A large enterprise transitioning from a traditional data center to a cloud-based architecture.
- Use Case 2: A small business setting up a secure and scalable network to support remote work.
- Use Case 3: Troubleshooting a complex network issue using detailed network diagrams.
Future trends in network diagrams
- IoT Integration: Representing the increasing number of connected IoT devices.
- 5G Networks: Adaptations in network diagrams to reflect the infrastructure of 5G technology.
- Virtual and Augmented Reality: Using VR and AR to create and visualize network diagrams.
Network diagram examples
Network diagrams vary by the type of network they represent and their network topology. Since network diagrams can be used to represent basically any network, you’ll find a lot of varieties out there.
Here are just a few examples.


How to make a network diagram
Before you start plopping down shapes and arranging them, make sure you’ve set a clear goal for your diagram. Then, think about what needs to be included to achieve that goal. Always remember: it’s better to create multiple diagrams to capture complex ideas rather than cramming too much information into a small space.
Once you’re ready to start diagramming, log in to your Cacoo account and open up the Editor. If you don’t have an account, you can sign up for a free trial here.
Next, follow these steps:
- Select a template or blank canvas. You can either select a relevant network diagram template to get you started or create your work from scratch with a blank canvas.
- Add all your equipment. Whether you’re working with a template or blank canvas, the first thing you want to do is make sure you have all the equipment you need on your canvas. Duplicate (Command/Ctrl+D) any shapes you need more of, delete ones you don’t, and add new ones from the library of shapes. Simply drag and drop shapes from the shape library onto your Cacoo canvas. Don’t worry about connections just yet. Focus on representing every device, server, router, firewall, or other component that is a part of the network.
- Arrange your shapes. Looking at your stated goal and the network topology you plan to follow, begin moving your shapes around the canvas. You can click each shape and use the helpful guidelines provided in Cacoo to align your objects properly.
- Label your components. Using text boxes, you can include any additional information your viewer may need to know, such as names, IP addresses, device types, etc. Alternatively, you can number each component and provide this information in a separate legend.
- Add connections. Use lines between your components to show how they are connected by the flow of information. You can move the existing lines if you initially chose a template or add new ones and style your lines. Arrows can depict whether an event is a merge event, burst event, or merge and burst event. And finally, adjust line styles with the inspector tool.
- Clean up your formatting. Once your layout is complete, you can make final adjustments to the placement, size, color, and other attributes of your diagram elements.
- Save your diagram & share it! Name your diagram. Then, choose from the various options for sharing your diagram, including exporting as a PDF or SVG, sharing on social media (Twitter, Google+, Facebook), or sharing with a link. You can also embed your diagram on a website.
Network diagram templates
While creating network diagrams from scratch is easy with Cacoo, using templates can greatly speed up your diagramming process.
There are many different types of network diagram templates to choose from in Cacoo. Simply open the Editor, choose a template to get you started, and begin customizing it to your flow.
If you create a diagram you think you’ll want to replicate, save it as a new template or shape. With custom templates and shapes, you can recreate your best work again and again.
Best practices for drawing network diagrams
- Use commonly accepted symbols and icons: Like most technical diagrams, there are commonly used shapes and icons people have come to expect when viewing a network diagram. Using shapes like the ones available in Cacoo ensures that your audience will easily understand your diagram. While it may be tempting to get overly creative with your diagram, the risk is usually not worth the reward.
- Don’t let lines cross one another: When lines cross, it becomes difficult to decipher the paths of information. Always create enough room in your diagram so that lines never have to cross.
- Align objects: Using the grid background option in Cacoo, along with the dotted guidelines that pop up when moving objects, it’s easy to properly align objects for consistency.
- Use different colors for different connections: You can use different colors for your connection lines to help viewers more easily decipher connection types.
- Always direct arrows from left to right: Your diagrams should flow in one direction, left to right, to keep the flow of your diagram clear.
- Make sure there is only one start event and one end event: If you are trying to represent more than one, try creating a separate diagram instead, so each one clearly only depicts one start and end.
Diagramming errors to avoid
There are a few common formatting errors you should always avoid.
1. Looping. Your elements should never form an endless loop in the network diagram. All information should go from the start event to the end event without getting trapped in a loop.
2. Dangling. You should also never have one element that is disconnected from all the other activities. If information enters this event, no activity will emerge from it.
3. Dummies. People sometimes use dummy elements for connections that don’t exist or are imaginary. Usually, these elements are represented by a dotted arrow.
IT networks vs. network diagrams for project management
IT network diagrams
- Purpose: These diagrams are used to visually represent the components and topology of a computer or telecommunication network.
- Structure: IT network diagrams include devices (e.g., routers, switches, servers, firewalls), connections (e.g., cables, wireless links), and sometimes data flows.
- Users: Network engineers, IT professionals, system administrators, and designers use these diagrams to plan, design, manage, and troubleshoot network infrastructure.
- Types:
- Physical network diagrams: Show the physical layout, including devices, cables, and hardware.
- Logical network diagrams: Display the logical structure of the network, such as subnets, device communication paths, and routing protocols.
- Topology diagrams: Illustrate different network topologies such as star, bus, ring, mesh, and tree.
Project management network diagrams
- Purpose: These diagrams help project managers and teams visualize the sequence of tasks, dependencies, and the overall workflow of a project.
- Structure: Project management network diagrams include tasks (activities), nodes (events), and arrows (dependencies and sequences).
- Users: Project managers, team members, stakeholders, and executives use these diagrams to plan, coordinate, track, and communicate project progress.
- Types:
- PERT (Program Evaluation and Review Technique) diagrams: Focus on the time required to complete tasks and identify the minimum project completion time.
- CPM (Critical Path Method) diagrams: Highlight the critical path of a project with key tasks that determine the overall project timeline.
- Gantt charts: Though not strictly a network diagram, Gantt charts provide a timeline view showing start and end dates for tasks, facilitating schedule management.
Key differences
-
Focus and content:
- IT network diagrams: Focus on hardware, software, and data flows within IT environments.
- Project management network diagrams: Focus on tasks, timelines, dependencies, and project scheduling.
-
Components:
- IT network diagrams: Include network devices, connections, and network infrastructure.
- Project management network diagrams: Include tasks, milestones, dependencies, critical paths, and timelines.
-
Design and symbols:
- IT network diagrams: Use symbols representing network hardware (e.g., router icons, switch icons) and relationships (e.g., lines indicating connections).
- Project management network diagrams: Use nodes, arrows, and lines to represent tasks, dependencies, and sequences.
-
Usage and users:
- IT network diagrams: Used by IT professionals to design, manage, and troubleshoot network setups.
- Project management network diagrams: Used by project managers and teams to plan, track, and communicate project tasks and progress.
Similarities
-
Visualization: Both types of network diagrams rely on visual representations to convey complex information in an easily understandable format.
-
Planning and organization: Both diagrams assist in the planning and organization of components/tasks to ensure smooth operation and completion (e.g., ensuring all necessary devices are connected or all tasks are sequenced correctly).
-
Communication tool: Both serve as communication tools, making it easier for teams to understand the structure and flow, whether it’s a network setup or a project plan.
Who uses each type?
-
IT Network Diagrams:
- Network Engineers and Designers: Design and optimize network layouts.
- System Administrators: Manage and troubleshoot network issues.
- IT Managers: Oversee the implementation and maintenance of network infrastructures.
-
Project Management Network Diagrams:
- Project Managers: Plan, schedule, and monitor project progress.
- Team Members: Understand their roles and the dependencies between tasks.
- Stakeholders: Gain insights into project timelines, milestones, and critical paths.
- Executives: Oversee project timelines and resource allocations.
By understanding these differences and similarities, users in both IT and project management domains can effectively leverage network diagrams to improve planning, execution, and communication within their specific areas.
Cacoo for network diagrams
Unlock the full potential of your team’s creativity and efficiency with Cacoo, the ultimate solution for creating network diagrams and more. Cacoo is designed to be simple to use, easy to learn, and built with collaboration at its core, making it the perfect choice for teams of any size.
Seamless collaboration
- Real-time collaboration: With our cloud-based editor, multiple team members can work on the same diagram simultaneously, promoting seamless collaboration and reducing the time spent on back-and-forth communications.
- In-app comments: Instantly gather feedback and make adjustments with our in-app commenting system. Team members can leave comments directly on the diagrams, ensuring clear and constructive discussions.
- Presentation mode: Present your diagrams effortlessly in meetings using our built-in presentation mode, making it easier to communicate complex ideas to stakeholders and team members.
- Video chat and in-app chat: Facilitate even more seamless collaboration with integrated video chat and in-app chat features. Discuss changes, brainstorm ideas, and make decisions without ever leaving the app.
- Follow mode: Keep everyone aligned by following colleagues around the diagram in real time. When one team member takes the lead, others can easily follow their view, simplifying coordination during collaborative sessions.
Effortless sharing and access
- Shared folders: Shared folders allow your entire team to access the diagrams they need, anytime and anywhere. Keep your projects organized and accessible to everyone who’s involved.
- Easy sharing: Sharing diagrams with stakeholders outside of your organization is a breeze. No downloading or account creation is required on their part—just send them a link, and they can view your diagrams instantly.
Versatile diagram creation
Powerful features
Sign up and take advantage of all the features that make Cacoo the best choice for your team:
- Advanced exporting options: Export your diagrams in multiple formats, including PNG, PDF, PPT, PostScript, or SVG.
- Revision history: Keep track of every change with our revision history feature. See what changes were made and when, and revert to previous versions if needed.
- Integrations: Full access to popular integrations, including Google Drive, Dropbox, Adobe Creative Cloud, and more. This means you can seamlessly incorporate Cacoo into your existing workflows.
- Team management: Easily manage your team with advanced features. Invite people to your organization, create groups, and assign roles to streamline collaboration and project management.
- Advanced security: Ensure your diagrams are securely managed with advanced security options that let you control who can view and edit your content.
Try Cacoo risk-free
Experience the power of Cacoo with our 14-day free trial. No credit card is required, so you can start exploring all these amazing features without any commitment.
Start your free trial today and see why Cacoo is the best solution for creating network diagrams online for teams!
This guide was originally published on February 9, 2018, and updated most recently on October 22, 2024.

