When planning any process, visualizing things as they flow from one person or component to another is a great way to consider every possibility. Beyond full-proofing your process, visuals make it easy to share with others so they can quickly understand and reference it. Luckily, flowcharts are also among the easiest diagrams to create, making it silly not to incorporate them into every project. This guide will show you how.
This guide is useful for:
- Anyone interested in visualizing a workflow or process,
- People struggling to communicate their ideas clearly,
- Marketers, Developers, HR, UX Designers, Visual Designers, or any other department that needs to communicate processes to other departments or stakeholders and
- Flowchart fanatics wanting to brush up on the fundamentals and stay up-to-date on new trends.
An overview of flowcharts
What is a flowchart?
A flowchart is a visual representation of a sequence of operations performed to create a particular outcome. It is commonly used to document complex processes, systems, and computer algorithms in a comprehensible way.
Each step in the sequence is noted with a diagram shape such as a rectangle, diamond, or oval. Steps are linked by connecting arrows that define the directional flow of steps. Anyone viewing a flowchart should be able to logically follow the process from beginning to end.
Some flowcharts are small, depicting only a few key steps of a process, while others are more comprehensive and able to represent complex sequences of steps and potential outcomes.
Flowcharts are often referred to by specialized names such as Process Flowcharts, Process Maps, Functional Flowcharts, Business Process Maps, Business Process Modeling and Notation (BPMN) diagrams, and Process Flow Diagrams (PFD).
History of flowcharts
Flowcharts have existed since the 1920s. Originally called “flow process charts,” they were developed by industrial engineers Frank and Lillian Gilbreth, who first presented them to the American Society of Mechanical Engineers (ASME) in 1921. Flowcharts quickly became a mainstay in industrial engineering for structuring work processes such as assembly line manufacturing.
In the 1930s, industrial engineer Allan H. Mogensen saw an opportunity to extend flowcharts and other useful industry tools to business workers. He began training business people to use flowcharts to make their processes more efficient, spreading their popularity and use.
Two fellow graduates of Mogensen’s class also helped popularize flowcharts in other industries. Art Spinanger trained employees at Procter & Gamble where he developed their Deliberate Methods Change Program. Ben S. Graham, also the Director of Formcraft Engineering at Standard Register Industrial, adapted flowcharts for information processing with the development of the multi-flow process chart to display multiple documents and their relationships.
By 1947, ASME adopted a symbol set derived from Gilbreth’s original work as the “ASME Standard: Operation and Flow Process Charts.”
In 1949, Herman Goldstine and John von Neumann developed a flowchart to plan computer programs. Flowcharts became popular for describing computer algorithms until the 1970s, when interactive computer terminals and third-generation programming languages were introduced. Source code then became a more concise way to express algorithms.
Nowadays, flowcharts are still used for describing computer algorithms, as well as a variety of business workflows and processes.
Types of flowcharts
Flowcharts can be used in practically any industry. A few examples would be manufacturing, architecture, engineering, business, technology, education, science, medicine, government, and administration.
Depending on what you’re working on and who you ask, flowcharts may be categorized or labeled differently.
Common flowchart types
In the 1978 book Microprocessors: Design and Applications, Andrew Veronis named three flowchart types based on their level of detail:
- General flowcharts: These provide an overview of a process or workflow. An example could be a high-level business process covering customer acquisition from initial contact to sale completion.
- System flowcharts: These identify the devices used in a process. An IT department might use system flowcharts to document the flow of data within a software application, showing how data moves from the input device to processing and then output device.
- Detailed flowcharts: These document specific details within a process, including intricate steps and decision points. For instance, a detailed flowchart might document the complex series of steps and checks in a financial auditing process.
Business-perspective flowcharts
In the 2001 book Quality and Process Improvement, Mark A. Fryman categorized flowcharts from a business perspective:
- Decision flowcharts: Used to explain the steps taken to justify a particular decision. For example, they could be used in a hiring process to determine which candidate moves forward based on specific criteria.
- Logic flowcharts: These are used to uncover loopholes in logic that could cause problems. A software developer might use logic flowcharts to debug and optimize an algorithm.
- Product flowcharts: These represent the sequence and flow of product creation, including manufacturing steps and quality checks. For instance, outlining the manufacturing process of a car, from assembly to quality control.
- Process flowcharts: These show any process taken to achieve an outcome. For example, documenting all steps in a customer service process from initial contact to issue resolution.
Industry-specific flowcharts
In the 2003 book Critical Incident Management, Alan B. Sterneckert designated four flowchart types based on what they control:
- Document flowcharts: These show the controls over document flow through the components of a system, such as various business units. For example, showing how a financial report moves through different departments for review and approval.
- Data flowcharts: These illustrate the flow of data through a system’s channels. IT departments often use these to illustrate data processing tasks within a software system.
- Program flowcharts: These display the sequence of operations in a computer program. Useful examples include outlining how an e-commerce platform processes an online purchase from the shopping cart to payment.
Other flowcharts
Additional flowchart types include:
- Swimlane diagrams, e.g., Swimlane flowcharts, Depict who does what in cross-team processes. They are useful in HR or project management to show team responsibilities and workflow.
- Workflow flowcharts: Document office workflows involving tasks, documents, and information, for instance, detailing the approval workflow for an internal document.
- Event-driven Process Chain (EPC) flowcharts: Document business processes where events trigger tasks. They are useful in operations management to visualize and optimize processes.
- Specification and Description Language (SDL) flowcharts: Used in software engineering to brainstorm computer algorithms, showing system definitions, blocks, and processes.
Flowchart uses by industry
While the history of flowcharts tells us they originated in industrial engineering before becoming popular in computer programming, they are also used widely today in many other fields.
Here are just a few common industries and uses.
How businesses use flowcharts
Here are a few examples of how businesses use flowcharts:
- Plan order and procurement processes: Optimize and standardize purchasing workflows.
- Draft user paths: Visualize paths that users take on a website or store for a better user experience.
- Product planning: Map out the entire lifecycle from conception to launch.
- Compliance: Ensure adherence to regulatory standards by documenting processes.
- Sales processes: Detail every step from lead generation to closing a sale.
How sales & marketing use flowcharts
Here are a few examples of how sales and marketing industries use flowcharts:
- Survey flow: Plan the sequence of questions in a survey for better response rates.
- Sales process: Streamline the procedure from lead qualification to follow-up.
- Research strategies: Organize the methodology for market or customer research.
- Registration flows: Optimize the steps for user registrations.
How manufacturing uses flowcharts
Here are a few examples of how manufacturing industries use flowcharts:
- Product creation: Illustrate the stages in the physical or chemical makeup of a product.
- Manufacturing process: Identify and resolve inefficiencies in the production line.
- Reverse engineering: Visualize the deconstruction of a product to understand its components.
How engineering uses flowcharts
Here are a few examples of how engineering industries use flowcharts:
- System flows: Design and optimize technological systems.
- Chemical processes: Plan and refine chemical treatment and production setups.
- Lifecycle analysis: Analyze the lifecycle stages of structures.
- Prototyping: Outline phases from design to prototyping of new products.
How education uses flowcharts
Here are a few examples of how education industries use flowcharts:
- Lesson plans: Organize educational content flow for better delivery.
- Scientific processes: Chart anatomical, biological, and chemical processes.
- Character development: Trace character arcs in literature and film studies.
- Algorithm visualization: Represent algorithms and logic problems for easier understanding.
Benefits of using flowcharts
Many people may not realize the benefits of visually documenting business processes, but they become clear once they start using them.
-
Standardization of processes: Flowcharts help standardize processes, ensuring consistency and quality across tasks and departments.
-
Enhanced efficiency: Visualizing processes helps quickly identify and eliminate bottlenecks, redundancies, and unnecessary steps, making workflows more efficient.
-
Improved communication: Flowcharts make it easy to communicate complex processes in a simple visual format, aiding understanding for stakeholders at all levels.
-
Effective training: They serve as an excellent training resource, helping new employees understand workflows quickly and accurately.
-
Better decision-making: By visualizing different pathways and decisions, teams can evaluate various outcomes and make informed choices.
-
Increased accountability: Clearly defined steps and responsibilities within a flowchart increase accountability among team members.
-
Facilitated problem-solving: Flowcharts make it easier to pinpoint issues within processes, enabling faster troubleshooting and problem resolution.
-
Documentation and compliance: They provide a clear and concise record of processes, aiding in compliance with industry standards and regulatory requirements.
-
Streamlined collaboration: Collaborative flowchart tools enable team members to work together in real time, fostering better team collaboration and idea sharing.
-
Visualization of the “Big Picture:” Flowcharts allow you to see the entire process at a glance, helping you understand the relationships between different tasks and steps.
-
Process optimization: Regularly reviewing and updating flowcharts can lead to continuous improvement and optimization of processes.
-
Enhanced project management: Use flowcharts to map out project timelines, tasks, and dependencies, improving project planning and execution.
-
Innovation and creativity: Visualizing processes can inspire new ideas and innovative ways to improve or completely re-engineer workflows.
-
Consistency in output: Ensures that every individual follows the same steps, leading to uniformity in output and reducing errors.
-
Clear role definition: Helps in clearly defining roles and responsibilities, reducing confusion and overlap of tasks.
Once you start thinking about your processes more visually, you’ll get a better understanding of what’s working and what’s not, which means you can replicate the good and start troubleshooting the bad.
Embrace the power of flowcharts to transform your workflows, drive efficiency, and foster collaboration. Start visualizing your processes today and unlock the myriad benefits flowcharts offer!
Creating flowcharts
Flowchart templates
In Cacoo, we offer a variety of templates and shapes to get your designs started. Starting from a template can save you a lot of time off the bat. Here are some examples of relevant templates available in Cacoo:
Basic Process Diagram: Ideal for mapping out basic workflows.

BPMN Diagram: Suitable for business process modeling.

Swimlane Flowchart: Useful for illustrating responsibilities in cross-functional teams.

Data Flowchart Template: Perfect for representing data paths in systems.

Decision Flowchart: Makes it easy to visualize a decision’s implication.

Flowchart symbols
There are a few basic flowchart shapes and symbols used to denote processes, decisions, documents, manual operations, and more. Uniform symbols make your flowchart more meaningful and easier to read. The below image shows the standard flowchart shapes available in Cacoo.
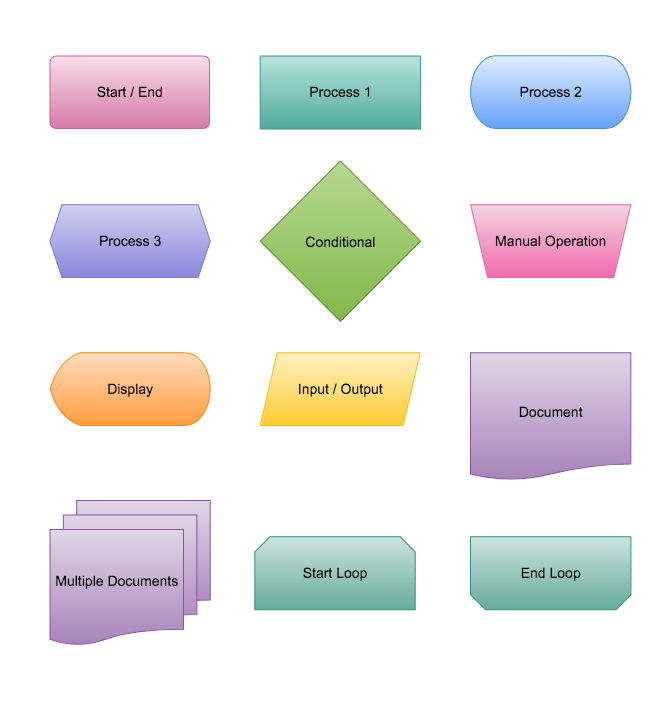
These flowchart shapes and meanings are fairly standard; however, some people do incorporate different shapes with different meanings into their flowcharts. You can add shapes, define specialized meanings, and tailor your flowchart symbols to your needs.
Here is a rundown of the most common flowchart shapes and their meanings.
- Start/End: Sometimes also referred to as a “terminator,” the Start/End symbol shows where your flow begins or ends. Within the shape, you should include the words “Start” or “End” to clarify which it is.
- Process 1: The most common shape for a process is the rectangle. It can signify any process, action, or operation in your flow. They are usually defined by their action, like “Edit blog,” “Create an account,” or “Select plan.”
- Process 2: Another shape used for processes is the rounded rectangle. This is used to represent an event that occurs automatically such an event will trigger a subsequent action, like “receive telephone call” or describe a new state of affairs.
- Process 3: Also called the “Preparation Symbol,” the Process 3 symbol represents a setup to another step in the process.
- Conditional: The diamond Conditional shape is also often called the “Decision” shape. This object symbolizes a question. The answer to that question determines which arrow to follow coming out of the diamond. There are usually at least two arrows coming from this shape, one indicating Yes or True and the other No or False. Arrows are labeled to avoid confusion.
- Manual Operation: This object represents actions where a user is prompted for information that must be manually inputted into a system.
- Display: The Display symbol indicates a step that displays information.
- Input/Output: Also known as the “data” object or the “I/O” shape, this Input/Output symbol refers to any information that enters or exits your flow.
- Document: This shape is pretty straightforward: it represents any document or report that takes part in the process flow.
- Multiple Documents: Similar to the Document shape, the Multiple Document shape simply clarifies that there are multiple documents involved in a single step.
- Start Loop: This shape indicates the beginning of a loop.
- End Loop: Conversely, this shape indicates the point at which a loop should stop.
How to create a flowchart
Once you understand the meaning of each symbol, putting together a flowchart is surprisingly easy. Gather all relevant information, build out each step of your flow piece by piece, and label your steps accordingly.
A successful flowchart will convey the information presented in an organized and efficient manner.
Follow these steps to create your own.
STEP 1: Select your tool
While you may start out taking notes with a pen and paper, eventually, you’ll want a diagramming tool to help you quickly outline your flow in a way that is easy to understand and professional-looking.
Our cloud-based diagramming tool, Cacoo, has everything you need to create beautiful flowcharts. Plus, you can try it out for free with our 14-day free trial.
If you fall in love, our paid plans provide plenty of sheets, sharing options, import/export options, revision history tools, and more. If you’re working on a team, you’ll love the collaborative features available on our Teams plan, including shared folders, simultaneous editing, commenting, and team management controls.
STEP 2: List your process steps
Once you’ve selected your tool, it’s time to list each step in your flow.
If you’re unsure of how certain pieces fit together at first, put them off to the side of your main diagram; incorporate them later.
Once you’ve listed out every step on your screen, note what’s missing.
- What parts of your flow don’t connect?
- Where does your flow trail off?
- Does your flow have a defined beginning, middle, and end?
- What needs to happen for your process to proceed?
- What decisions need to be made along the way to make the flow happen?
STEP 3: Add symbols & shapes
Each step you’ve listed can be represented by a particular shape based on the symbols we listed earlier, which are all available in Cacoo.
For each step of your flow, make sure it’s symbolized by the correct shape. You can drag and drop any shape right onto your canvas in the Cacoo Editor. Double-click the shape to add text. You can copy/paste any action items you’ve already listed into the correct shape.
Begin with the Start/End symbols. Then add your Process and Conditional symbols, followed by connecting arrows giving direction to your flow. Add in more specialized shapes after to polish off your diagram.
STEP 4: Optimize your flow
Once you’ve created a comprehensive first draft of how things work currently, you can begin to analyze any bottlenecks, duplicate efforts, or unaccounted pieces.
Work with team members and others to optimize your flow for maximum efficiency. You may need to add or remove steps, or perhaps there’s a better order of actions for your flow. Play around with different versions of your flowchart until you’re happy with the result.
STEP 5: Ask someone to review your work
The simplest way to verify that your flowchart is easy to read is to ask a fresh pair of eyes to walk you through what they see the flow to be. If they get caught up in a particular step or section of steps, you may need to rework your diagram.
Custom templates & shapes
While drawing flowcharts from scratch is easy with Cacoo, using templates can greatly speed up your diagramming process.
You can choose from many different types of flowchart templates. Simply open the editor, choose a template to get you started, and begin customizing it to your flow.
If you create a diagram you think you’ll want to replicate, save it as a custom template or shape. With custom templates and stencils, you can recreate your best work again and again.
Advanced tips & tricks
Best-practices
- Consider your audience: While many flowchart symbols are universally accepted, you can customize your symbols to your audience as long as you’re sure that the audience will recognize the alternative imagery you’ve selected.
- You can import images right into Cacoo or use one of the many other shapes available in our Shapes library.
- Use uniformity: Readability is incredibly important for flowcharts. If they aren’t easy to read and process, what was the point in creating such a comprehensive visual?
- Adjust the size of your shapes so that they are uniform as the flow progresses. If you use a particularly sized rectangle, stick with that same width/height throughout.
- For arrows, keep them flowing in the same direction. They typically flow from left to right or top to bottom. Make sure that you’re naming your arrows after any Conditional/Decision shape is used. And make sure you are consistent with how many arrows enter and exit particular shapes.
- Ideally, only one line or arrow should come out of a process symbol. Only one flow line should enter a decision symbol, but multiple (usually 2-3) can exit the symbol. Only one flow line should be used with a Start/End symbol.
- Be concise: Use text sparingly within your symbols. If your audience has to read too much, you slow down how quickly your information can be absorbed.
Common mistakes
The most common mistakes people make with flowcharts are mostly related to making them clear and readable. Some people do too much, some not enough. Both can diminish the effectiveness of your flowchart.
- Using the wrong symbols: While it may not seem important at first to choose a rectangle rather than a diamond for all processes, it’s important for your audience. Readers accustomed to the commonly agreed-upon meanings of flowchart symbols may struggle to read your flowchart if you’ve assigned your shapes at random.
- Flowing in multiple directions: The most widely accepted flow directions are top to bottom and left to right. Choose one and stick to it. Going against the norm or trying to combine the two will most certainly confuse viewers.
- Using too many (or not enough) colors: Colors should help tie like pieces together visually. If you assign a color to the process shape, use it consistently. If you get too creative with colors or don’t use enough color to separate disparate parts of your flow, your design can become confusing to read or fall flat.
- Inconsistent branch directions: Many people overlook which types of arrows come from which part of the shape. More specifically, when dealing with the Conditional symbol, e.g. Decision symbol, you should have all “True” conditions flowing from the bottom of the diamond and all “False” conditions flowing out the right side.
- Inconsistent spacing: You want to maintain even spacing around your symbols, with enough room for each one to breathe without stretching so far that your diagram becomes mostly white space.
Flowcharts for developers
While today’s developers use source code to express algorithms, flowcharts are still a useful tool for developers, especially when they’re working with cross-functional teams that include non-developers.
For collaboration to be effective, others must be able to understand what you’re doing and why. Flowcharts make it easy for everyone to understand how things work and collaborate on creative solutions to your unique business opportunities.
You can also use flowcharts to demonstrate the logic behind a new feature or product before starting to code. This saves time and provides an overview your team can follow for what needs to be done.
In addition, flowcharts can:
- Illustrate the way code is organized
- Detail the execution of code within a program
- Plan the structure of a website or application
- Demonstrate how users navigate a website or program
Developers also use a number of related diagrams, such as Unified Modeling Language (UML) diagrams, Network Diagrams, Sitemaps, and more.
Why Choose Cacoo?
Cacoo is simple to use, easy to learn, and built with collaboration in mind. Whether you’re working alone or with a team, our platform offers advanced features to elevate your diagramming experience.
Using our cloud-based editor, your team can collaborate on diagrams in real-time. With in-app comments, video and chat features right on diagrams, and our presentation mode, you can get instant feedback and seamlessly refine your work.
Cacoo has everything you need to create diagrams with your team, including:
- Video and In-App Chat: Communicate effortlessly with your team without leaving the platform.
- Follow Mode: Follow along as a team member works on a diagram, ensuring everyone is on the same page.
- Timer: Keep track of time spent on projects to boost productivity and manage deadlines.
- Code-to-Graph: Automatically generate graphs from code snippets, perfect for developers.
- Kanban Tool: Manage your projects and workflows with visual Kanban boards integrated into Cacoo.
- Media Library: Store and access media files easily to enrich your diagrams.
Plus, everything you need to share your work, like:
- Shared Folders: Give your team easy access to all the diagrams they need.
- Quick Sharing: Share diagrams with important stakeholders in seconds—no downloading or account creation required on their part.
And with paid plans, you get even more:
- Advanced Exporting Options: Export in formats including PNG, PDF, PPT, PostScript, or SVG.
- Revision History: View change logs and revert to previous versions.
- Full Access to Integrations: Sync with Google Drive, Dropbox, Adobe Creative Cloud, and more.
- Team Management: Invite people to your organization, create groups, and assign roles.
- Advanced Security: Manage access to diagrams, so you know exactly who’s seeing them.
Try it out for yourself with our 14-day free trial. No credit card required.
Join the 2,500,000+ users who depend on Cacoo for their flowchart & diagramming needs and see how it transforms your workflows today!
This guide was originally published on October 13, 2017, and updated most recently on October 29, 2024.