Introduction
The more complex a system, the more important it is to represent it visually. The process of physically mapping out components makes it clearer what’s working, what’s not, and where there are opportunities for improvement. And using a common language, like UML diagrams, helps teams collaborate on these issues.
This guide will introduce you to the Unified Modeling Language and the diagrams that represent it. In no time, you and your team can utilize UML diagrams for your projects.
This guide is useful for:
- Anyone interested in visualizing a complex system,
- System architects, software engineers, and software developers looking for an introduction to UML diagrams, and
- People wanting to brush up on the fundamentals of UML and updates to UML 2.5.
An overview
What is modeling?
Modeling is a way to visualize your software application design and check it against requirements before your team starts to code. In the same way that an architect creates a blueprint before starting construction on a skyscraper, a developer can use modeling diagrams to solidify and test what they are going to create before they start coding.
Mapping out a plan is the first step to any project, and modeling is an essential part of any software project, small or large. For an application to function well, it must be architected to enable scalability, security, and execution.
Using Unified Modeling Language (UML) diagrams, you can visualize and verify the designs of your software systems before code implementation makes changes difficult and expensive to execute.
What is the UML?
According to the Scope of the latest version of UML 2.5’s specification documentation, “the objective of UML is to provide system architects, software engineers, and software developers with tools for analysis, design, and implementation of software-based systems as well as for modeling business and similar processes.”
UML itself is not a programming language, though there are tools that can generate code using UML diagrams. UML is a modeling language for designing systems. It was created by combining several object-oriented notations—Object-Oriented Design (i.e., Booch), Object Modeling Technique (OMT), and Object-Oriented Software Engineering (OOSE)—making it a natural fit for object-oriented languages and environments like C++, Java, and C#; however, you can also use it to model non-OO applications in languages like Fortran, VB, or COBOL.
Because UML establishes a standard semantic and syntactic structure, you can use it to model almost any type of application, regardless of your hardware, operating system, programming language, or network. UML allows you to specify, visualize, and document models of software systems both structurally and behaviorally before coding.
History of UML
UML was developed by Grady Booch, Ivar Jacobson, and James Rumbaugh (aka ‘The Three Amigos’) in the mid-90s. The initial versions of UML were created by integrating three of the leading object-oriented methods—namely, Booch, OMT, and OOSE—developed by UML’s founders, respectively. They also incorporated best practices from modeling language design, object-oriented programming, and architectural description languages. Their efforts led to the release of UML 0.9 and 0.91.
In 1996, The Three Amigos led a consortium called the UML Partners to complete the UML specification. The partnership included several important individuals and organizations, including HP, DEC, IBM, and Microsoft. The resulting UML 1.1 was proposed to the Object Management Group (OMG) for standardization and adopted in November 1997. OMG has managed the language ever since.
With the help of an even larger consortium, UML 2.0 was introduced in 2005 and published as an approved standard by the International Organization for Standardization (ISO). After the release of several more versions, the current version, UML 2.5, was released in October 2012 as an “In process” version that was officially released in June 2015.
You can download the complete UML 2.5 document here.
Benefits of UML diagrams
Modeling your software before you build it provides a number of benefits to teams. For one, it helps establish a logical order of a team’s activities. Knowing what artifacts need to be developed helps define the tasks that teams will need to complete. Modeling also helps your team establish criteria for monitoring and measuring a project’s products and activities.
While some people might worry that using UML diagrams could lock them into a waterfall style of software development, that isn’t necessarily true. UML diagrams can be created and used at various stages of development, and they can be continuously updated and iterated.
Other key benefits include:
- Reducing redundancies. Diagrams make it easier for programmers to see redundant code and reuse portions of code that already exist rather than rewriting those functions.
- Simplifying changes. Making changes to diagrams at the start is much easier than reprogramming code later. This will save your team valuable time and money.
- Clarifying ambiguity. Design documentation can only go so far. In the long run, you’ll need it to communicate with new or faraway developers unfamiliar with your product’s history.
Why UML?
UML is the most widely used and understood modeling language. UML is, by far, the most popular modeling language used today. That ubiquity is itself a benefit because most developers, regardless of their specialties or work history, will be familiar with at least some UML diagrams. And because they are meant to be understood by any type of programmer, they don’t require the ability to read a certain programming language to be useful.
Three of the most popular UML diagrams will cover most of your modeling needs. Though there are 14 different types of UML diagrams for modeling applications, in practice, developers only use a few to document their software systems. The most common UML diagrams you’ll see and use are class diagrams, sequence diagrams, and use case diagrams. That means knowing how to create and read only 20% of this language will suffice for most of your projects.
Types of UML diagrams
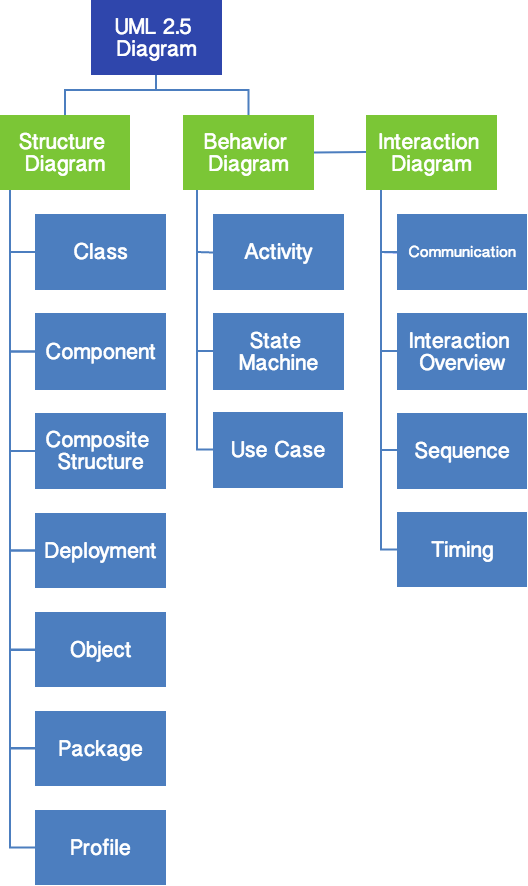
As of UML 2.5, there are now fourteen officially recognized UML diagrams which are split into two main types:
1. Structure diagrams show how the static parts of a system relate to each other. Each element represents a particular concept and may include abstract, real-world, and implementation factors.
2. Behavior diagrams show the dynamic behavior of all objects in a system, including changes to the system over time. Interaction diagrams can be thought of as a subset of behavior diagrams.
Structure diagrams in UML
There are seven structure diagrams in UML 2.5:
- Class diagrams show the structure of a system as related classes and interfaces with their features, constraints, and relationships.
- Component diagrams show components and the dependencies between them.
- Composite structure diagrams show the internal structure of a classifier and the behavior of collaborations the structure makes possible.
- Deployment diagrams show a system’s various hardware and the software deployed on it.
- Object diagrams show a real-world example of a structure at a specific time.
- Package diagrams show packages and the dependencies between those packages.
- Profile diagrams show custom stereotypes, tagged values, and constraints.
Behavior diagrams in UML
There are also seven behavior diagrams, the last four of which fall under the interaction diagram subset:
- Activity diagrams show business or operational workflows of components in a system.
- Use Case diagrams show how functionalities relate under particular actors.
- State machine diagrams show the states and state transitions of a system.
- Communication diagrams* show the interactions between objects in terms of sequenced messages.
- Interaction overview diagrams* show an overview of the flow of control, with nodes representing interactions or interactions’ uses.
- Sequence diagrams* show how objects communicate and the sequence of their messages.
- Timing diagrams* show the timing constraints of a system in a given time frame.
*Interaction diagrams
UML glossary & terms
Before you get started, it will be helpful to know some terms that will be used throughout this guide.
- Abstract Class – A class that will never be instantiated nor will ever exist.
- Abstract syntax compliance – Users can move models across different tools, even if they use different notations
- Activity – A step or action within an activity diagram that represents an action by the system or by an Actor.
- Activity Diagram – A flowchart that shows the process and its correlating decisions, including an algorithm or a business process.
- Actor – An object or person that initiates events in the system.
- Aggregation – Part of another class.
- Artifacts – Documents that describe the output of a step in the design process. The description is either graphic, textual, or both.
- Association – A connection between two elements of a model.
- Association Class: A Class that adds information to the Association between two other Classes.
- Attributes – Characteristics of an object that reference other objects or save objects’ state information.
- Base Class – A Class that defines Attributes and Operations that are inherited by a Subclass using a Generalization relationship.
- Branch – A decision point in an Activity Diagram. Multiple Transitions emerge from the Branch, each with a Guard Condition.
- Class – A category of similar Objects, all described by the same Attributes and Operations and all assignment-compatible.
- Class Diagram – Shows the system classes and relationships between them.
- Classifier – A UML element that has Attributes and Operations. Specifically, Actors, Classes, and Interfaces.
- Collaboration – A relation between two Objects in a Communication Diagram, indicating that Messages can pass back and forth between the Objects.
- Common Warehouse Metamodel (CWM) – Standard interfaces that are used to enable the interchange of warehouse and business intelligence metadata between warehouse tools, warehouse platforms, and warehouse metadata repositories in distributed heterogeneous environments
- Communication Diagram – A diagram that shows how operations are done while emphasizing the roles of objects.
- Component – A deployable unit of code within the system.
- Component Diagram – A diagram that shows relations between various Components and Interfaces.
- Concept – A noun or abstract idea to be included in a domain model.
- Concrete syntax compliance – Users can continue to use a notation they are familiar with across different tools
- Construction Phase – The third phase of the Rational Unified Process, during which several iterations of functionality are built into the system under construction. This is where the main work is done.
- Core In the context of UML, the core usually refers to the “Core package,” which is a complete metamodel particularly designed for high reusability
- Dependence – A relationship that indicates one Classifier knows the Attributes and Operations of another Classifier but isn’t directly connected to any instance of the second Classifier.
- Deployment Diagram – A diagram that shows relations between various Processors.
- Domain -The part of the universe that the system is involved with.
- Elaboration Phase – The second phase of the Rational Unified Process that allows for additional project planning including the iterations of the construction phase.
- Element – Any item that appears in a Model.
- Encapsulation – Data in objects is private.
- Event – In a State Diagram, this represents a signal or event or input that causes the system to take an action or switch States.
- Final State – In a State Diagram or an Activity Diagram, this indicates a point at which the diagram completes.
- Fork – A point in an Activity Diagram where multiple parallel control threads begin.
- Generalization – An inheritance relationship in which a Subclass inherits and adds to the Attributes and Operations of a Base Class.
- Generalization – Indicates that one class is a subclass in another class (superclass). A hollow arrow points to the superclass.
- GoF – Gang of Four sets of design patterns.
- High Cohesion – A GRASP evaluative pattern that makes sure the class is not too complex, doing unrelated functions.
- Inception Phase – The first phase of the Rational Unified Process that deals with the original conceptualization and beginning of the project.
- Inheritance – Subclasses inherit the attributes or characteristics of their parent (superclass) class. These attributes can be overridden in the subclass.
- Initial State – In a State Diagram or an Activity Diagram, this indicates the point at which the diagram begins.
- Instance – A class is used like a template to create an object. This object is called an instance of the class. Any number of instances of the class may be created.
- Interface – A Classifier that defines Attributes and Operations that form a contract for behavior. A provider Class or Component may elect to Realize an Interface (i.e., implement its Attributes and Operations). A client Class or Component may then Depend upon the Interface and thus use the provider without any details of the true Class of the provider.
- Iteration – A mini project section during which some small piece of functionality is added to the project. Includes the development loop of analysis, design, and coding.
- Join – A point in an Activity Diagram where multiple parallel control threads synchronize and rejoin.
- Language Unit – Consists of a collection of tightly coupled modeling concepts that provide users with the power to represent aspects of the system under study according to a particular paradigm or formalism
- Level 0 (L0) – Bottom compliance level for UML infrastructure – a single language unit that provides for modeling the kinds of class-based structures encountered in most popular object-oriented programming languages
- Low Coupling – A GRASP evaluative pattern that measures how much one class relies on another class or is connected to another class.
- Member – An Attribute or an Operation within a Classifier.
- Merge – A point in an Activity Diagram where different control paths come together.
- Message – A request from one object to another asking the object receiving the message to do something. This is basically a call to a method in the receiving object.
- Meta Object Facility (MOF) – An OMG modeling specification that provides the basis for metamodel definitions in OMG’s family of MDA languages
- Metamodel – Defines the language and processes from which to form a model
- Metamodel Constructs (LM) – Second compliance level in the UML infrastructure – an extra language unit for more advanced class-based structures used for building metamodels (using CMOF) such as UML itself. UML only has two compliance levels
- Method – A function or procedure in an object.
- Model – The central UML artifact. Consists of various elements arranged in a hierarchy by Packages, with relations between elements as well.
- Model-Driven Architecture (MDA) – An approach and a plan to achieve a cohesive set of model-driven technology specifications
- Multiplicity – Shown in a domain model and indicated outside concept boxes, it indicates object quantity relationship to quantiles of other objects.
- Navigability – Indicates which end of a relationship is aware of the other end. Relationships can have bidirectional Navigability (each end is aware of the other) or single directional Navigability (one end is aware of the other, but not vice versa).
- Notation – Graphical document with rules for creating analysis and design methods.
- Note – A text note added to a diagram to explain the diagram in more detail.
- Object – Object: In an Activity Diagram, an object that receives information from Activities or provides information to Activities. In a Collaboration Diagram or a Sequence Diagram, an object that participates in the scenario depicted in the diagram. In general: one instance or example of a given Classifier (Actor, Class, or Interface).
- Object Constraint Language (OCL) – A declarative language for describing rules that apply to Unified Modeling Language. OCL supplements UML by providing terms and flowchart symbols that are more precise than natural language but less difficult to master than mathematics
- Object Management Group (OMG) – Is a not-for-profit computer industry specifications consortium whose members define and maintain the UML specification
- Package – A group of UML elements that logically should be grouped together.
- Package Diagram – A Class Diagram in which all of the elements are Packages and Dependencies.
- Parameter – An argument to an Operation.
- Pattern – Solutions used to determine responsibility assignment for objects to interact. It is a name for a successful solution to a well-known common problem.
- Polymorphism – Same message, different method. Also used as a pattern.
- Private – A Visibility level applied to an Attribute or an Operation, indicating that only code for the Classifier that contains the member can access the member.
- Processor – In a Deployment Diagram, this represents a computer or other programmable device where code may be deployed.
- Protected – A Visibility level applied to an Attribute or an Operation, indicating that only code for the Classifier that contains the member or for its Subclasses can access the member.
- Public – A Visibility level applied to an Attribute or an Operation, indicating that any code can access the member.
- Reading Direction Arrow – Indicates the direction of a relationship in a domain model.
- Realization – Indicates that a Component or a Class provides a given Interface.
- Role – Used in a domain model, it is an optional description of the role of an actor.
- Sequence Diagram – A diagram that shows the existence of Objects over time and the Messages that pass between those Objects over time to carry out some behavior.
- State – In a State Diagram, this represents one state of a system or subsystem: what it is doing at a point in time, as well as the values of its data.
- State chart diagram – A diagram that shows all possible object states.
- State Diagram – A diagram that shows the States of a system or subsystem, Transitions between States, and the Events that cause the Transitions.
- Static – A modifier to an Attribute to indicate that there’s only one copy of the Attribute shared among all instances of the Classifier. A modifier to an Operation to indicate that the Operation stands on its own and doesn’t operate on one specific instance of the Classifier.
- Stereotype – A modifier applied to a Model element indicating something about it that can’t normally be expressed in UML. In essence, Stereotypes allow you to define your own “dialect” of UML.
- Subclass – A Class that inherits Attributes and Operations that are defined by a Subclass via a Generalization relationship.
- Swimlane – An element of an Activity Diagram that indicates what parts of a system or a domain perform particular Activities. All Activities within a Swimlane are the responsibility of the Object, Component, or Actor represented by the Swimlane.
- Time Boxing – Each iteration will have a time limit with specific goals.
- Transition – In an Activity Diagram, represents a flow of control from one Activity or Branch or Merge or Fork or Join to another. In a State Diagram, represents a change from one State to another.
- Transition Phase – The last phase of the Rational Unified Process during which users are trained on using the new system and the system is made available to users.
- UML – Unified Modeling Language utilizes text and graphic documents to enhance the analysis and design of software projects by allowing more cohesive relationships between objects.
- UML 1 – First version of the Unified Modeling Language
- Unified Modeling Language (UML) – A visual language for specifying, constructing, and documenting the artifacts of systems
- Use Case – In a Use Case Diagram, represents an action that the system takes in response to some request from an Actor.
- Use Case Diagram – A diagram that shows relations between Actors and Use Cases.
- Visibility – A modifier to an Attribute or Operation that indicates what code has access to the member. Visibility levels include Public, Protected, and Private.
- Workflow – A set of activities that produces some specific result.
- XMI -An XML-based specification of the corresponding model interchange format
How to create UML diagrams
As we mentioned in the previous section, though there are 14 different types of UML diagrams, developers typically use just a few to cover most of their modeling needs. In this section, we’ll discuss how to create activity diagrams, class diagrams, sequence diagrams, and use case diagrams.
Templates and shapes for these and more UML diagram types are available in Cacoo.
Activity diagrams
An activity diagram is exactly what it sounds like — a diagram that creates a visual depiction of an activity. The activity diagram itself can hold any amount of information detailing a wide variety of actions. If you can think of a workflow, you can diagram it out.
Using words and symbols, you can map out workflows to include the order in which tasks and operations need to be done, who needs to do them, what tasks can only be done once others are completed, which tasks are free-standing, and more.
Actions are tasks performed by a user, the system, or both in collaboration.
Connectors link the actions in sequence.
Nodes indicate the start or end of an activity. They can also indicate a fork or merge.
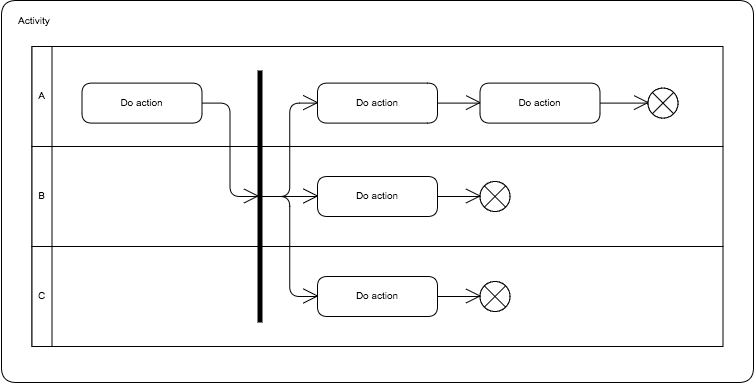
How to create an Activity Diagram in Cacoo:
- In the Cacoo editor, go to Templates and select the Activity Diagram template.
- Use round-edged rectangles to represent each action.
- Use lines to demonstrate the flow of actions from one to another.
- Use a circle to indicate the end of an activity.
- Optionally, arrange actions into swimlanes corresponding to different objects or business roles that perform the actions.
- Save your diagram.
Class diagrams
Class diagrams are a subsection of Structural UML diagrams and function as the most basic building tool to create applications.
It is most widely used to depict OOP content, more efficient app design and analysis, and as the base for the deployment and component diagram.
Classes represent data or object types. They are visualized using a rectangular shape with the class name as the top section.
Attributes are the named values that every instance of a type can have. They are listed under the class name.
Methods are the functions that instances of a type can perform. They are listed below attributes.
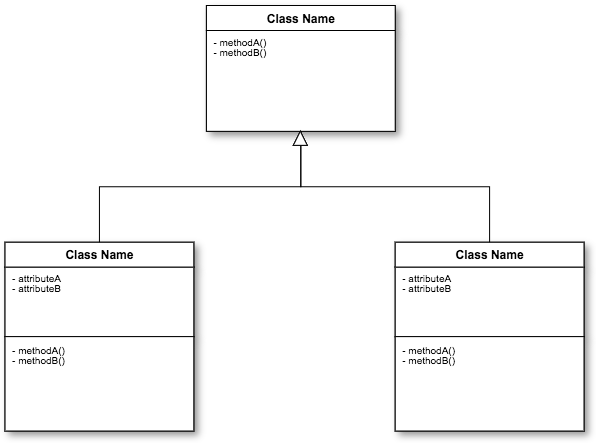
How to create a Class Diagram in Cacoo:
- In the Cacoo editor, go to templates and select the Class Diagram template.
- Add all classes, attributes, and methods.
- Add new class shapes as necessary to fit your data.
- Use lines to draw any associations, inheritances, or dependencies between types. Your notation style will determine the styling of these lines.
- Save your diagram.
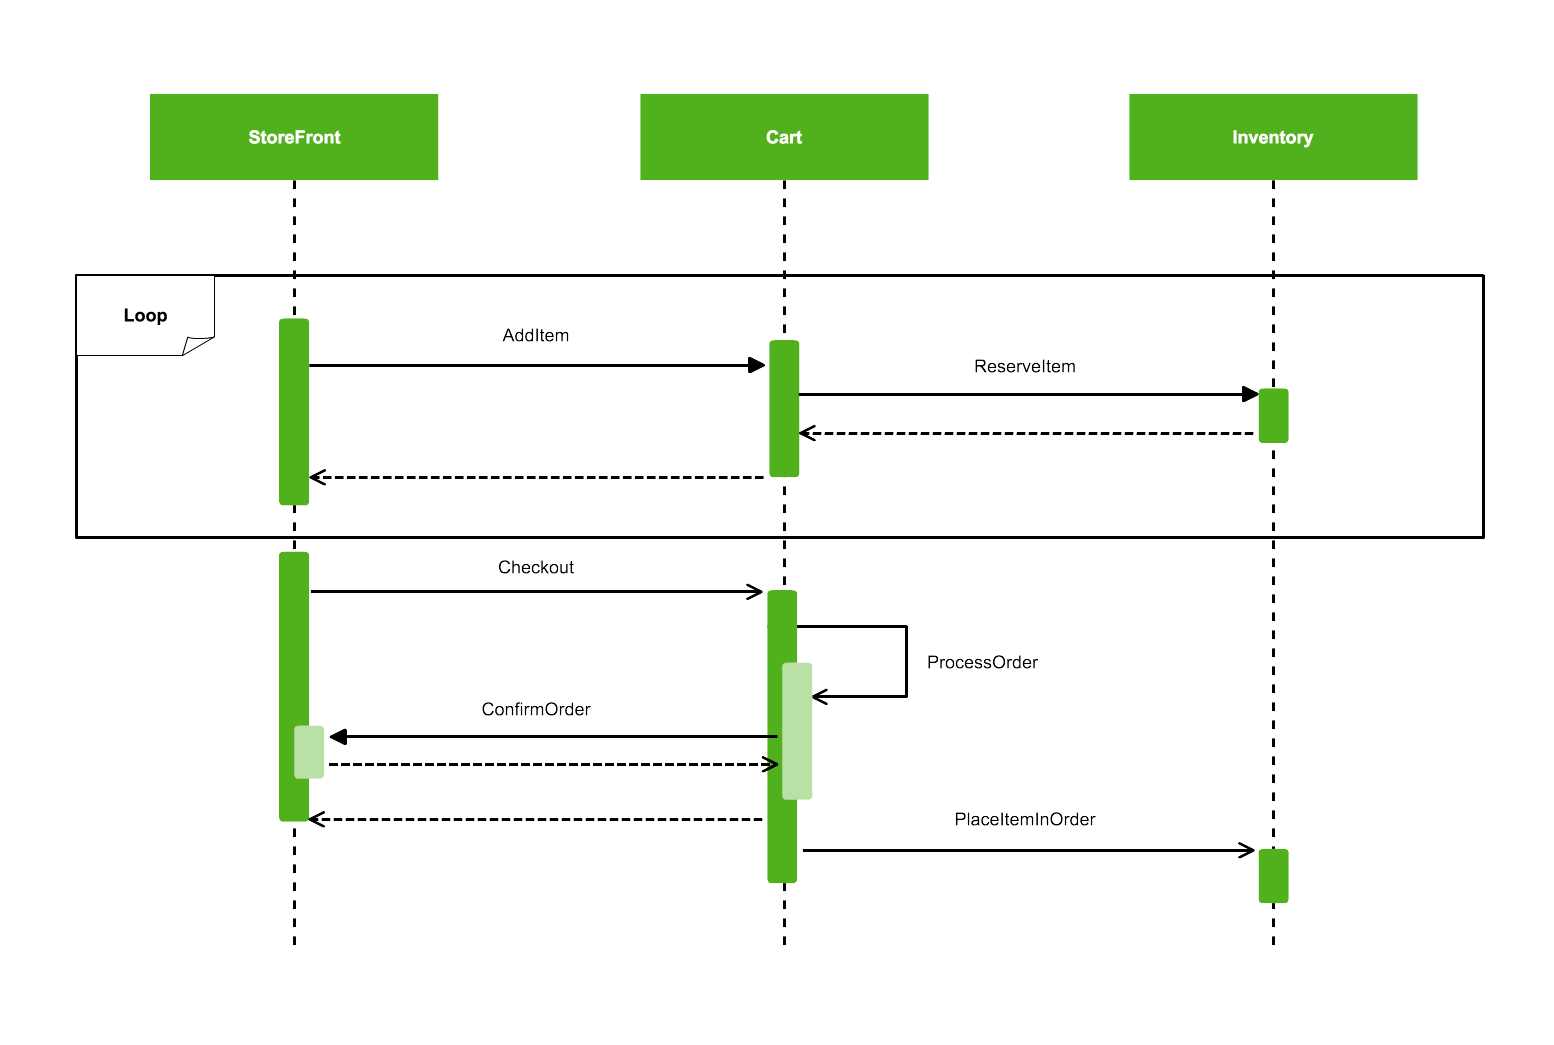
Sequence diagrams
The difference between a sequence diagram and other types is that the sequence diagram depicts the actions in more detail. You can easily see how they are implemented, by whom, in what order, what needs to be completed beforehand, and what can be done after.
At a higher level, a sequence diagram can show how the process moves forward over time, including the order of actions. It, therefore, also shows the interaction between multiple actions, the passage of time, and the completion of past tasks, which moves the process forward.
Classes represent data or object types. They are visualized using a rectangular shape.
Lifelines are vertical lines that represent the sequence of events that occur to a participant as time progresses. This participant can be an instance of a class, component, or actor.
Messages are represented by lines between objects.
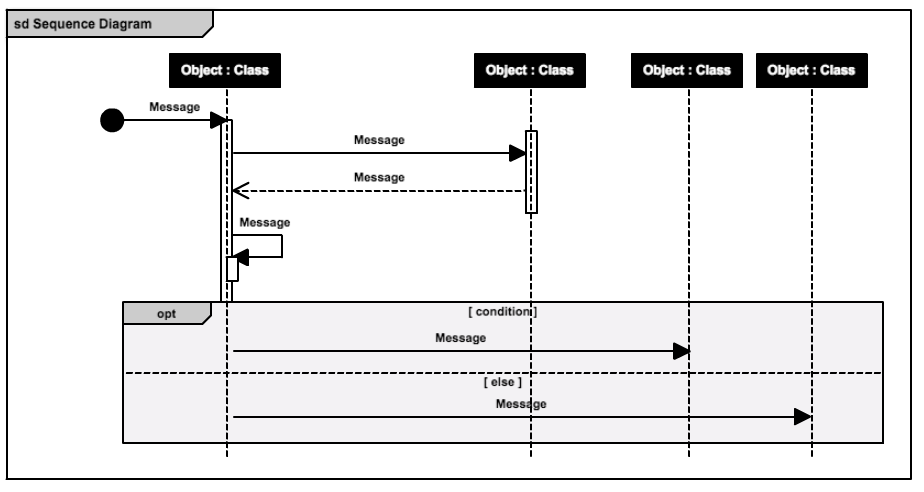
How to create a Sequence Diagram in Cacoo:
- In the Cacoo editor, go to Templates and select the Sequence Diagram template.
- Use rectangular boxes to indicate class instance names, class names, or objects.
- Use vertical lifelines to show sequences of messages in chronological order and horizontal elements to show object instances as messages are relayed.
- Draw lines to represent the sender and receiver of messages. Use solid arrowheads to symbolize synchronous messages, open arrowheads for asynchronous messages, and dashed lines for callback messages.
- Save your diagram.
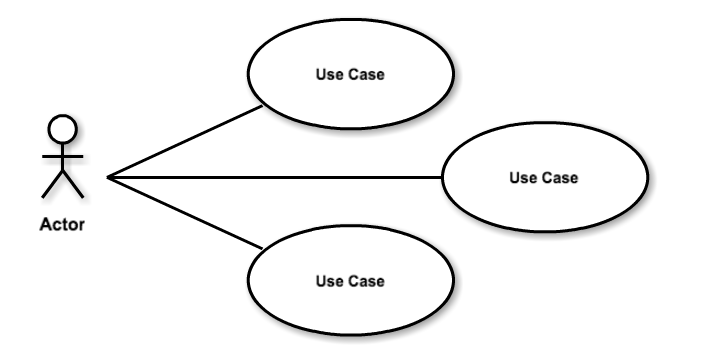
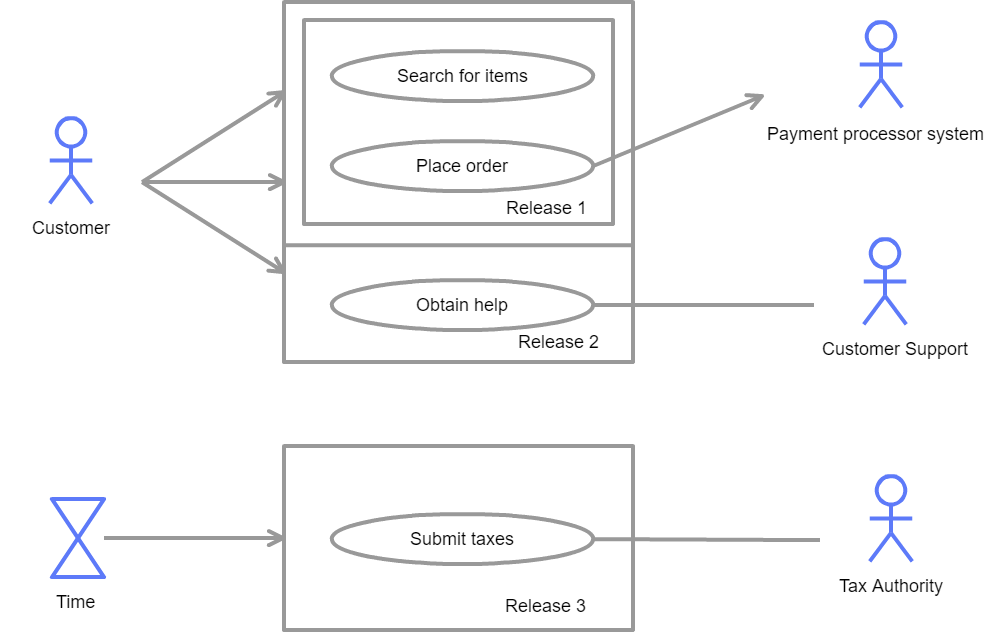
Use case diagrams
Use case diagrams help communicate what the end result of an underdeveloped application will be. They’re extremely useful in meeting with a client and creating the idea of the functions, letting the developers work backward from there. Since this diagram focuses mainly on functionality and end results, it shows much more of WHAT the app will do without very much explanation of HOW the app will perform these individual functions.
Actors represent users, organizations, or external systems that interact with your application or system. An actor is a kind of type.
Use Cases represent the actions performed by one or more actors in the pursuit of a particular goal. A use case is a kind of type.
Associations indicate where an actor takes part in a use case.
How to create a Use Case Diagram in Cacoo:
- In the Cacoo editor, go to Templates and select the Use Case Diagram template.
- Label your actors with stick figures (available under Stencils > Software > UML) or other relevant illustrations.
- Use ovals to label your use cases.
- Use lines to model the relationships between actors and use cases.
- Save your diagram.
Example UML use cases by industry
At this point, you might be asking when the need for UML diagrams comes up in real life. Well, here are a few examples of where you might see teams use UML diagrams from various industries.
- Industry: Finance
- Use: Banking System Architecture
- Description: A leading bank used UML diagrams to model their core banking system. Class diagrams were used to define customer, account, and transaction entities, while sequence diagrams illustrated the workflow of a transaction processing system, ensuring compliance with regulatory requirements and internal policies.
- Industry: Healthcare
- Use: Hospital Management System
- Description: A hospital used UML diagrams to design a hospital management system. Use case diagrams identified interactions between patients, doctors, and administrative staff. Activity diagrams were employed to map out patient admission and discharge processes, improving efficiency and coordination among departments.
- Industry: E-commerce
- Use: Online Shopping Platform
- Description: An e-commerce company leveraged UML diagrams to develop an online shopping platform. Class diagrams defined product categories, customer profiles, and order management. Sequence diagrams detailed the shopping cart process, from product selection to checkout, enhancing the user experience and backend processing efficiency.
Integrating UML into the software development lifecycle
It’s not enough to understand how to build UML diagrams. You also have to know how they can fit into your existing workflows. Here are a few ways you might incorporate UML diagrams into common practices in your development team like Agile, Scrum, and DevOps.
- Agile
- Iterative Development: Create and refine UML diagrams iteratively throughout the Agile sprints.
- User Stories: Use use case diagrams to visualize user stories and their interactions with the system.
- Daily Stand-ups: Discuss updates to diagrams during stand-up meetings to ensure everyone is on the same page.
- Scrum
- Sprint Planning: Use activity diagrams to outline the tasks and workflows for each sprint.
- Retrospectives: Review UML diagrams during retrospectives to identify improvements and document changes.
- Product Backlog: Maintain updated UML diagrams in the product backlog for clear requirements and design understanding.
- DevOps
- Continuous Integration: Integrate UML tools with continuous integration pipelines to automatically update documentation.
- Automation: Generate UML diagrams from code using plugins and ensure they are accurate reflections of the system.
- Collaboration: Share UML diagrams in shared repositories accessible by both development and operations teams.
Integrating UML with other development tools
You will also likely want to integrate your UML diagrams and workflows into your other tools. Especially your version control system and project management software.
Version control
Let’s say your team is using Git for version control. You might use UML diagrams for:
- Documentation in Repositories: Store UML diagrams in repositories alongside your code. Use tools that support UML format files to keep them version-controlled.
- Branching: Collaborators can create branches for different features, updating UML diagrams as the design evolves. Use pull requests for diagram review and approval.
Project management software
Let’s say your team is using Backlog as their project management tool (which includes built-in Git repositories for every project.) You might use UML diagrams to:
- Task Management: Link UML diagrams to relevant tasks or issues in Backlog. This helps track which parts of the diagram correspond to specific development items.
- Annotations and Comments: Use Cacoo’s comment feature to provide feedback directly on UML diagrams, facilitating discussion and iteration. Use issue comments to share updates and request feedback.
Implementing review processes for UML diagrams
Another consideration when implementing UML diagrams is quality. Creating a formal review process will ensure that your diagrams are as helpful as possible.
Review checklist
Ensure you’re checking each of the following for every UML diagram.
- Accuracy: Verify that diagrams accurately reflect system requirements and design intentions.
- Clarity: Ensure diagrams are clear, with no overlapping lines or ambiguous elements.
- Completeness: Check that all necessary components are represented and that relationships are correctly defined.
Review workflow
This is a simple example of a review workflow you can use to create your own.
- Initial creation: Diagrams are created by a designer and shared with the team.
- Peer review: Team members review the diagrams, focusing on potential issues and suggesting improvements.
- Feedback loop: The designer incorporates feedback and iterates on the diagram.
- Approval: Once refined, the diagram is formally approved and integrated into project documentation.
Object-oriented concepts in UML
Object-oriented conceptualizing is simply the idea of taking objects that exist in the real world and turning them into flows and processes within your UML diagram. Developers do this daily to break difficult concepts or problems into solvable issues within their diagrams as they build applications.
UML relationships
Relationships within a UML diagram may seem somewhat self-explanatory, but they can be a bit much to wrap your head around at first. The relationships within your diagrams connect two concepts or actors. Each line you draw in your diagram represents a relationship you are creating.
These relationships include:
- Association – The general term encompassing all types of relationships
- Directed association – A relationship flowing in a specific direction, annotated with an arrow
- Reflexive association – A relationship where a class has more than one function
- Multiplicity – When the cardinality of the class is depicted in the relationship
- Aggregation – When a class is built due to the formation or grouping of another class, i.e. from ‘wolf’ to ‘pack’
- Composition – Similarly to Aggregation, a new class is formed depending on a previous class
- Inheritance / Generalization – A class created with a child/parent relationship
- Realization – Relationship depicting the inter-functionality between two classes
UML templates
While creating UML diagrams from scratch is easy with Cacoo, using templates can greatly speed up your diagramming process.
In Cacoo, you can choose from many different types of UML diagram templates. Simply open the editor, choose a template to get you started, and begin customizing it to your flow.
If you create a diagram you think you’ll want to replicate, save it as a new template. With custom templates and shapes, you can recreate your best work again and again.
UML symbols
Cacoo offers a set of UML symbols, so you don’t have to worry about creating them all anew. This will not only save you time but will also give your diagram a look of consistency as well as prevent it from looking too cluttered.
Despite being templated out, the symbols’ actual form and size can be easily edited, stretched, rotated, etc., to suit your specific needs.
UML cheat sheet
Need another source to easily remember, track, or look up some information on UML diagrams or what symbols to use when? Check out these handy links for extra resources:
- Getting started with UML
- MSDN UML Overview
- Holub UML Guide
- UML 2.0 Reference
- Cheatsheet by Lou Franco
- EDN Article
- UML Diagrams by Kirill Fakhroutdinov
Additional Resources
Books and articles
- Books:
- “UML Distilled: A Brief Guide to the Standard Object Modeling Language” by Martin Fowler.
- “Applying UML and Patterns” by Craig Larman.
- Articles:
- Explore articles on sites like InfoQ, IEEE, and ACM Digital Library.
Online courses
- Coursera: Courses on Software Engineering and UML.
- Udemy: Specialized UML courses, often with project-based learning.
- Pluralsight: Detailed courses covering UML basics to advanced topics.
Forums and communities
- Stack Overflow: Sections dedicated to UML and software modeling.
- Reddit: Subreddits like r/UML or r/softwareengineering.
- LinkedIn: Learning groups focusing on UML and systems engineering.
Advanced tips & tricks
Best practices
When sharing your diagrams with others, you want to make sure they’re easy to understand, clean, and follow consistent rules. These factors won’t change your actual model, but they will greatly improve your ability to communicate your system and goals to your team.
Keep fonts & colors to a minimum
Readability is important for understanding. When viewing your diagram, all text should be large enough to be legible. If the text can only be read when zoomed in, your diagram has too much information or is too complicated.
Also, don’t try to get too fancy with fonts. Generally, you can stick to one font type. If you feel confident in your typography skills, you can venture into two or even three but never add fonts just for the sake of looks. If your designs aren’t adding to the readability of your diagram, they’re taking away from it.
Colors can be a great way to show differentiation in your diagram. It can increase readability and make your diagrams look more professional. However, when taken too far, color can distract your reader from the information at hand or even confuse the reader if not applied uniformly. When using color, think sparingly. Try to stick to the least number of colors necessary to bring clarity to your diagram. It can also be useful to provide a key or legend for colors.
Less information is more useful
Diagrams should focus on just a few key elements with a limited perspective. If you try to include too many elements in your diagrams, they can quickly grow so large and complex that they become too difficult for anyone to actually read.
Large diagrams don’t convey more information; they create more confusion. For complex systems, split the information up into smaller, more easily digestible diagrams.
When thinking about how much information to include or exclude, imagine what your diagram would look like printed out on a standard sheet of paper. If it would be too difficult to read, scale back and try again.
You also don’t have to name every attribute, association, or constraint contained within a diagram. Only display items that are relevant to the current perspective of the diagram. That information can be elaborated on within a separate diagram.
No crossing lines
No two lines in your diagram should cross. This is important not only for clarity but to ensure that your system does not contain a design flaw.
If you are unable to uncross two or more lines on your diagram, you either have:
- Too much information in one diagram. Maybe you’re trying to combine two different perspectives, or you’re just trying to go too in-depth for a single diagram. Remember, less information is often more useful.
- A design flaw in your model. The worst-case scenario is that your system contains a design flaw, but it’s better to figure that out now than later. All working systems can be displayed without crossing lines. If you’re finding it a challenge to visualize your system, try figuring out if there’s an element you’ve overlooked.
Right angles only
All lines in your diagrams should run either horizontally or vertically. All angles should be right angles. Straightening out your lines will instantly add clarity to your diagrams.
The only exception to this rule is use cases, which sometimes use angled lines to represent relations.
Parents over children
When drawing hierarchies on a diagram, always place parent elements higher than child elements so that arrows will always point upwards.
Most follow this rule without even learning it, but every once in a while, someone tries to flip their hierarchies upside down. For consistency’s sake, always put parents first. Your readers shouldn’t have to orient themselves to new rules to understand your flow.
If you have multiple elements descending from the same parent, use a vertical tree style to demonstrate your hierarchy.
Keep it consistent
Consistency extends beyond fonts and colors. When you’re done with your diagram, run a quick check to make sure you’ve treated every element equally.
- Always double-check to make sure your elements are aligned, either by one side or by their centers.
- Make sure elements of the same type are the same size when possible.
UML diagrams are only as useful as they are readable. If your audience doesn’t understand them, you’ve wasted everyone’s time. Following these rules will ensure that you’re delivering organized, clean diagrams that any team member can pick up and understand.
Advanced UML techniques
As you become well-versed in UML, you may want to explore more advanced methods and applications. Here are a few to keep in mind.
- Model-Driven Development (MDD): Model-Driven Development involves using UML models to automatically generate code. This ensures consistency between design and implementation and reduces manual coding errors.
- Custom Stereotypes and Profiles: Extend UML by creating custom stereotypes and profiles to match your specific domain requirements. This customization allows you to tailor UML diagrams to represent special-purpose modeling concepts.
- Validation and Verification: Implement validation and verification techniques to ensure UML diagrams accurately represent system requirements. Use tools that check for consistency, completeness, and correctness of diagrams against project specifications.
Cacoo for UML diagrams
Cacoo is simple to use, easy to learn, and built with collaboration in mind.
Using our cloud-based editor, your team can collaborate on diagrams in real time. With video chat, in-app chat, comments and presentation mode, you can get easy feedback to quickly refine your work. Shared folders give your team gets access to all the diagrams they need. And sharing diagrams with important stakeholders takes seconds (no downloading or account creation required on their part).
You can create all kinds of professional diagrams — not just UML diagrams — including wireframes, sitemaps, network diagrams, flowcharts, and more.
Sign up to start using:
- Advanced exporting options: PNG, PDF, PPT, PostScript, or SVG
- Revision history: See what changes were made and when
- Full access to integrations: Including Google Drive, Dropbox, Adobe Creative Cloud, and more
- Team management: Invite people to your Organization, create groups, and assign roles
- Advanced security: Manage access to diagrams so you know exactly who’s seeing them
Try it out for yourself with our 14-day free trial. No credit card required.
This guide was originally published on December 11, 2017, and updated most recently on October 31, 2024.

