It’s a fact of life that things don’t always go to plan. But the secret to turning a mistake into a success isn’t a time machine (helpful though that might be) — it’s figuring out where you went wrong. Not only does this make it easier to fix the error — it also helps you make sure you and your team don’t make the same mistake again.
Fishbone diagrams are a handy tool to help you do just that: root out the cause of an issue by working backward in steps.
In this article, we’re going to take a look at what fishbone diagrams are, why they’re useful, and how to get started with your very own (including tips on how to use a fishbone diagram template the right way). Let’s get started.
What is a fishbone diagram?
You know how, in time travel movies, the main character is often told not to touch anything they’re not supposed to — even something seemingly tiny — because it could have a huge effect on the future? That’s because of something known as the butterfly effect (a scientific theory that basically means a small change in one place could = massive change somewhere else). Anyway, long story short — this is what happens in real life.
Think about the last time you smashed a glass. It wasn’t that you just knocked it with your elbow — there was a whole load of events leading up to that moment. For example, you slept through your alarm, had OJ instead of coffee because it’s quicker, washed the dishes in a rush… There are multiple ‘if only I hadn’t…’ moments — and the same is true for things that happen in the workplace.
A fishbone diagram (aka an Ishikawa Diagram, named after its founder Kaoru Ishikawa — an organizational theorist) is a diagram designed to help you find the potential causes leading to an event — such as an imperfection on a production line. You start with a problem or defect (this forms the ‘head’ of your diagram), then work your way back, step-by-step (these are the ‘ribs,’ which are grouped into categories).
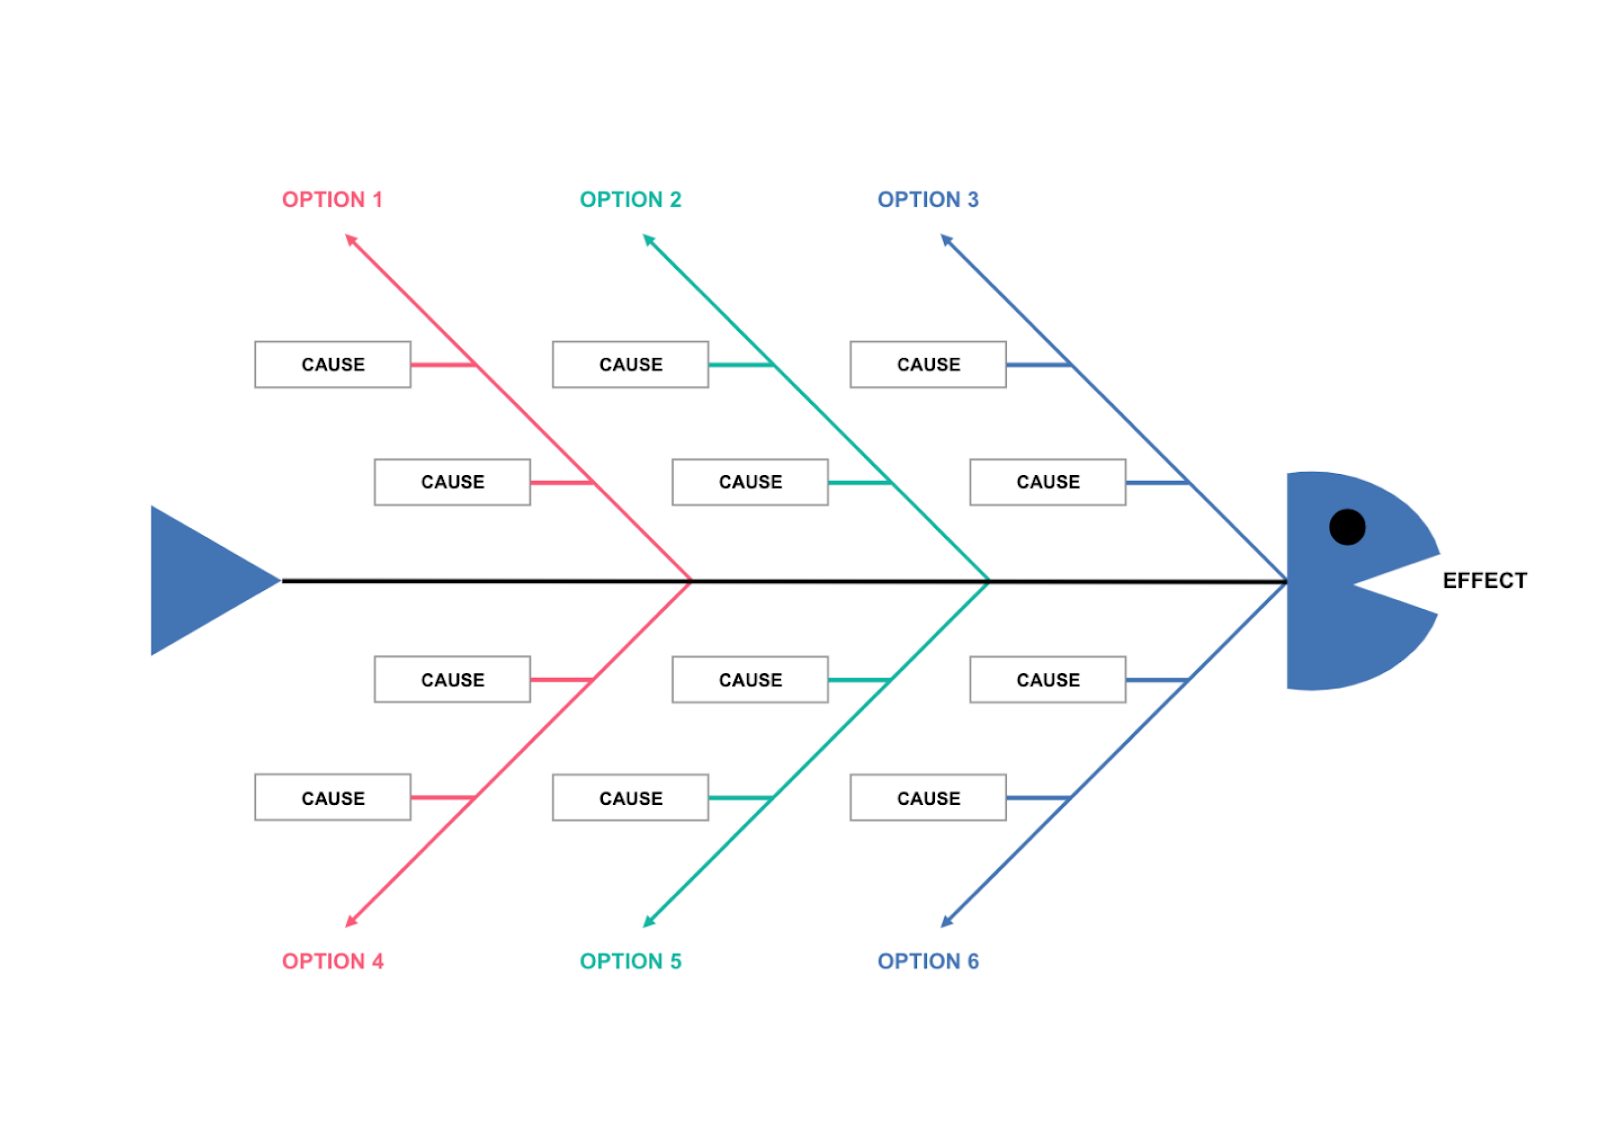
Created in Cacoo
Fishbone diagrams should be a collaborative effort. Typically, teams work together to group factors that contribute to a problem to create a map of contributing factors. This makes it easier to address the cause of a problem rather than just fix the outcome.
The goal isn’t to define one definitive problem, but rather to consider all the small events that could have played a part. This gives you a nuanced, full picture of your project’s development.
Advantages and disadvantages of a fishbone diagram
As a quality control tool, fishbone diagrams are one of the most popular. They’re easy to create and excellent for getting the team to work collaboratively toward a solution. They’re also helpful when the team has hit a dead end and needs some structure to help them think about the underlying causes of a problem. Here are some of the advantages and disadvantages:
The good bits…
- Displaying information visually makes it easier to understand (and diagrams are always a good tool for presenting information to managers and stakeholders)
- It’s a good tool for brainstorming
- Quickly see how multiple causes feed into the main issue and see them simultaneously
- Identify whether the same root cause appears in different diagrams
Things to watch out for
- Interrelationships between causes aren’t always obvious
- Complex issues might yield lots of causes, which can make your diagram appear cluttered and confusing. If you find this happening, you may want to try a fault tree analysis instead (it allows you to go into more detail)
How to use a fishbone diagram
Simplicity is hands-down the best thing about a fishbone diagram. They’re easy to make, easy to use, and easy to understand. Here’s how to get started.
1. Gather the team together
Fishbone diagrams should be collaborative. The more people involved, the more perspectives you’ll have. And when it comes to figuring out problems, this is the way to go. If your team is huge, ask the senior members of each discipline or department to speak to those they’re responsible for, then ask them to relay their findings back to you in a group meeting.
2. Choose your tools (and make your diagram)
Use a diagramming tool to make the whole process that bit more collaborative. Using cloud-based software can help you streamline the process. Rather than grappling with versions and update emails, you can just share one doc, set editing capabilities, then let the platform manage the notifications automatically. That’s one less thing for you to worry about.
3. Define your problem(s)
Once you have your diagram, it’s time to brainstorm. First, define the problem, including what it is, when it occurred, and how. Starting with ‘why’ questions makes it easier to start thinking about causes.
4. Create your categories
Start thinking about the categories surrounding your problem. For example, budget, suppliers, scheduling, software, staff… Add each of these to the main boxes at the top of each ‘rib.’
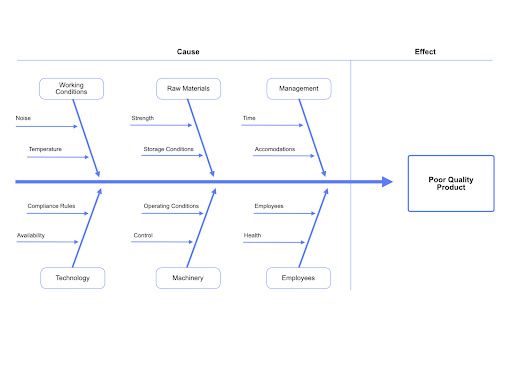
Made in Cacoo
5. Work backward
Once you have your categories in place, start adding your contributing causes to the main issue according to their category. Keep adding items until all potential causes have been identified.
6. Analyze the diagram
Together with the rest of the team, discuss the various causes until you agree on everything that should be there is there. You can do this together, in person, or leave notes on a diagramming tool. Either way, the more collaborative you can make this stage, the more accurate your diagram will be.
7. Decide on the next steps
Once you’ve done that, it’s time to look at how to fix the problem (and make sure it doesn’t happen again).
Final thoughts
Fishbone diagrams are a helpful tool for working out the root cause(s) of a problem. This is good news when something goes wrong. Rather than pointing the finger or papering over the cracks, it allows you to pause and stop the problem at its root in a measured and logical way.
When it comes to creating your diagram, there are a couple ways to go about it. You can make a fishbone diagram using a word doc and some shapes, or put pen to paper — but it’s much easier to use a fishbone diagram template. Using a dedicated diagramming tool means everyone can collaborate on the same document in real-time, share quick feedback, stay in the loop with each other — and create, share, and work together to solve problems more efficiently.
About Author

Georgina Guthrie
Guest authorGeorgina is a displaced Brit currently working in France as a freelance copywriter. Before moving to sunnier climates, she worked as a B2B agency writer in Bristol, England, which is also where she was born. In her spare time, she enjoys old films and cooking (badly).