In the same way that swimming lanes apply a sense of order to a busy pool, a swimlane diagram organizes complex information into neat, categorized rows. A swimlane diagram is a type of flowchart that provides clarity by sorting the steps of a process into horizontal or vertical “swimlanes” that represent departments or categories. Swimlane diagrams are also known as functional bands, multi-column charts, or Rummler-Brache diagrams.
The beauty of arranging your information like this is that you can see both the separate groups and the connections between everything. For example, someone in a large organization can see both the individual processes of different departments and how these processes form a whole.
What are the benefits of a swimlane diagram?
Aside from being an organizational tool, swimlane diagrams also highlight the flaws or strong points in your business processes. Plotting out core processes makes it easier to pinpoint — and therefore eliminate — bottlenecks, waste, and inefficiency, such as duplicate tasks being performed in different departments.
You can also use a swimlane diagram for change management, such as staff reassignments or project reassessments because you can see the impact these changes will have on a department or process.
Types of swimlane diagrams
Swimlane diagrams are relatively flexible. Your lines can run horizontally or vertically, and you can have as many lanes as you need.
The decision to lay your lines out in one direction or the other is generally down to preference and/or screen configuration. If your monitor is wider than it is tall, then go for horizontal lines.
Swimlane diagram symbols explained
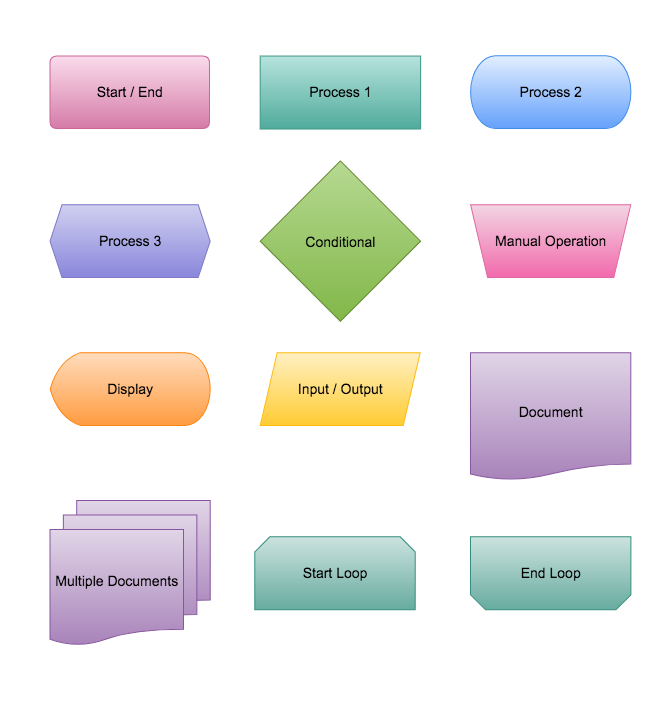
The symbols you use in a swimlane diagram are the same as in a regular flowchart. To recap:

- Start/End: this shows where your flow begins or ends. Include the words “Start” or “End” within the shape for clarification.
- Process 1: this signifies any process, action, or operation. Use it to define an action, such as “write article,” “create schedule,” or “water plants.”
- Process 2: the rounded rectangle is another shape used for processes. They usually represent automatic events that trigger a subsequent action, such as “receive feedback.”
- Process 3: this represents a setup to another step in the process.
- Conditional: also known as the “decision shape,” this symbolizes a question. The answer to that question determines which arrow to follow coming out of the diamond. Label the arrows as well to avoid confusion.
- Manual Operation: this represents an action where a user is prompted for information that must be manually input into a system.
- Display: this symbol indicates a step that displays information.
- Input/Output: also referred to as the “data” object, this symbol represents any information that goes into or comes out of your flow.
- Document: this shape represents any document or report that takes part in the process flow.
- Multiple Documents: this shape simply clarifies that there are multiple documents involved.
- Start Loop: this shape represents the beginning of a loop.
- End Loop: this shape indicates the point at which a loop should finish.
How to create a swimlane diagram in eight easy steps
1. Choose the right tools for the job
There are several ways you can go about creating your diagram. If you’re short on time and doing this as a personal project, then scribbling your diagram by hand is perfectly acceptable.
But if you need to make something clear and professional-looking, start off using sticky notes or a pen and paper, and then move on to diagramming software once you’ve organized your ideas. Not only will it look neat, but thanks to templates and readymade symbols, you can create and edit your diagram quickly and easily.
2. Define your goal
What’s your ultimate goal? Which processes do you need to include in your diagram? Think about how much detail you should include to give everyone a clear understanding of the overall picture.
3. Break the work down
Break your processes down into separate tasks while keeping an eye on the complete process and its boundaries. Note everything down; you can refine your list later on.
4. Identify your lanes
First, you need to choose which way you want your swimlanes to flow. Once you’ve figured that out, list the different lane categories, which could include participants, departments, or workgroups. If you change your mind later on, you can just rotate your lines.
5. Add your processes
Next, add the sequential process steps in their appropriate swimlanes using standard flowchart symbols. Remember to include the connections between the different lanes, and add details about the deadlines and who’s responsible for each task.
6. Analyze your diagram
Record your process as-is, but keep an eye out for gaps, duplication, bottlenecks, and other issues. If you’re creating a swimlane diagram for a new process, remember to go into as much detail as possible when explaining process steps that could potentially improve efficiency and quality.
7. Get the team involved
Finally, run your diagram past all the relevant team members and stakeholders to make sure they’re all on board. This stage is especially useful because other team members can help you identify any stages you may have missed.
If you do make any edits to your original diagram, remember to share the updates with everyone and, if necessary, explain your changes to give people another chance to comment.
8. Share and use your diagram
Congratulations! Your swimlane diagram is done. Now, you can use it to communicate responsibilities, standardize training processes, and discover inefficiencies — which you can either do internally or with the help of external analysts.
And remember to store it somewhere visible and easily accessible — ideally on the cloud. Refer back to the diagram periodically when there’s a significant change, such as a new employee, process, or department.
How to create a swimlane diagram in Cacoo
Creating a swimlane diagram in Cacoo, our own diagramming software, couldn’t be easier.
Simply click on ‘Templates’ on the left-hand side of the page, and select either ‘swimlane flowchart’ or ‘decision flowchart.’ A readymade swimlane diagram will pop up. From there, you can edit the shapes, lanes, colors, and text by dragging and clicking on the different elements.
Alternatively, you can select a regular decisions flowchart from the list of templates, and add swimlanes to it at a later date by selecting the line-draw function. Or, if you want to start with a blank slate, simply select ‘Create diagram’ and open a fresh page. From there, you can find all the shapes, arrows, and line elements you need in the left-hand column.
You can then save your diagram, duplicate it, and use it as the foundation for another process or share it with your whole organization.
Swimlane diagram tools
Using a specially designed diagramming tool makes the swimlane process a whole lot easier, thanks to readymade templates you can edit with a click. It means you don’t need to teach yourself (or your team) how to use complex illustration programs, nor do you have to struggle with formatting issues while using software that isn’t designed to deal with complex diagramming.
Another bonus is that you can share all your hard work with the wider team via the cloud, which means it’s available to everyone wherever they are. No more struggling to find documents on the server, no more hunting around for the correct version, and no more creating time-consuming email updates to let everyone know you’ve edited your diagram. Everything you need is right there at your fingertips.
This post was originally published on July 10, 2019, and updated most recently on January 12, 2022.

![What is process flow? [tips and examples]](https://cdn.nulab.com/learn-wp/app/uploads/2024/11/15203737/blog-process-flow.png)


