ER diagrams vs. EER diagrams: What’s the difference?
Cacoo Staff
May 21, 2024
When designing your database, an entity-relationship diagram (ER diagram or ERD for short) is an excellent way to visually outline your plans. In some cases, you may want to opt for an enhanced entity-relationship diagram (EER diagram or EERD for short), which includes a few more elements than ER diagrams.
So, which one should you choose? When deciding which diagram is best for your project, consider the following.
What is an ER diagram?
An entity-relationship diagram (ER diagram), also called an entity-relationship model, is aptly named because it shows the relationships between entities within an ER model. ER diagrams are most commonly used to organize data within databases or information systems. Their purpose is to visually represent the structure and logic of databases, making it easier to understand and manage complex data relationships.
There are two kinds of ER diagrams: conceptual and physical. Conceptual diagram models can provide the foundation for logical data models or show commonality relationships between ER models as a basis for data-model integration.
ER diagram symbols
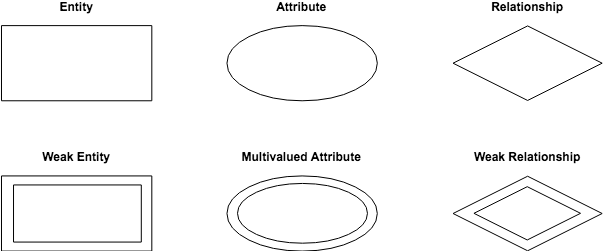
A conceptual ER diagram uses six standard symbols.
- Entities are objects or concepts that represent important data. Also known as strong entities or parent entities, these entities will often have weak entities that depend on them.
- Attributes are characteristics of an entity (i.e., many-to-many or one-to-one). The primary key is crucial in establishing unique identification and relational schema.
- Relationships are associations between entities.
- Weak entities depend on another entity.
- Multivalued attributes are attributes that can have more than one value.
- Weak relationships are the connections between a weak entity and its parent.

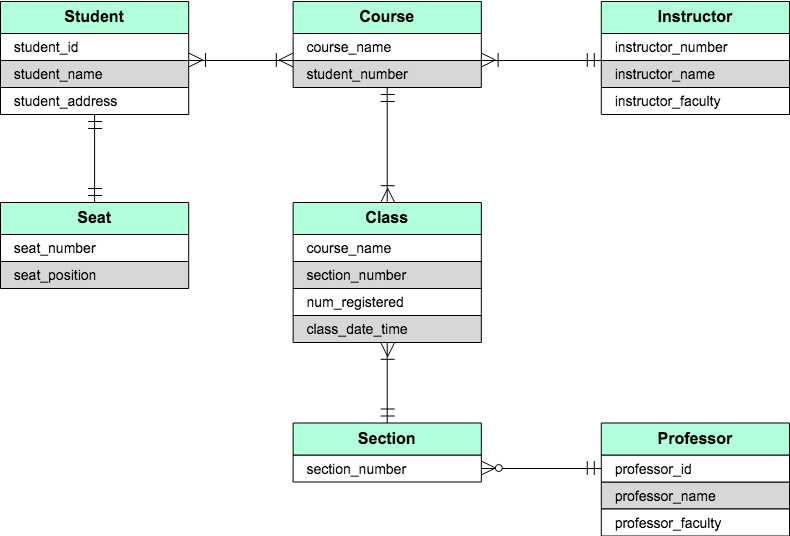
Physical diagram models are more granular, showing the processes necessary for adding information to a database. Rather than using symbols, they consist of a series of tables.
Each entity is represented as a table, with each field acting as an attribute of the entity containing it.

Entities are connected via a system of notation called crow’s foot notation. The styling of the endpoint of each line distinguishes the relationship.

The types of relationships in an ER diagram depend on the entity’s interactions with the other elements. Relationships can be one-to-one (1:1) or one-to-many (1:m). In some instances, the relationship will include many-to-many (m:m).
The entity-relationship model
“Entity-relationship model” is just another name for the entity-relationship diagram. First coined in the 1970s by MIT professor Peter Chen, the “entity-relationship model” was the original working title for the new diagram in his seminal paper “The Entity-Relationship Model: Toward a Unified View of Data.” If you see one name or the other while working, don’t get confused — they’re one and the same.
What is an EER diagram?
Enhanced entity-relationship (EER) diagrams are a more expansive version of ER diagrams. They are helpful tools for designing databases with high-level models. With their enhanced features, you can plan databases more thoroughly by delving into the properties and constraints with greater precision.
An EER diagram provides you with all the elements of an ER diagram while adding:
- Attribute or relationship inheritances
- Category or union types
- Specialization and generalization
- Subclasses and superclasses
Overall, an EER diagram builds off of an ER diagram by including elements that allow for aggregation, generalization, and specialization.
Generalization and specialization act as opposites of one another. Generalization combines lower-level entities into one of a higher level. Meanwhile, specialization divides high-level entities into lower levels. With aggregation, two entities are treated as a single one.
By using the additional components, you can quickly sort and group the relationships within the system for efficient placement.
How to create an ER diagram
1. Define the scope of the database
Make sure you have a clear understanding of the scope of data you intend to cover and your reasons for charting it in this manner. ER diagrams are only useful for data sets with logical, structured relationships. They also don’t consider how system interactions might cause an entity’s attributes or relationships to change. In such cases, other models, such as UML diagrams, are better suited for the job.
2. Use natural language constructs
When Peter Chen first developed entity-relationship models, he recommended using grammar constructs to define notation labels. The following list provides a rough breakdown.
- Entity = proper noun (i.e., David Smith)
- Entity type = common noun (i.e., user)
- Relationship type = transitive verb (i.e., purchases)
- Attribute type = intransitive verb (i.e., signs in)
- Entity attribute = adjective (i.e., subscribed)
- Relationship attribute = adverb (i.e., monthly )
While this model doesn’t work for everyone, it provides a good starting point for organizing your diagrams. For instance, it’s perfectly fine to use nouns for attributes if that makes more sense. The most important thing is to be as consistent as possible in labeling the different components. That way, others will have an easy time understanding the data you’re trying to relay.
3. Don’t duplicate an entity
Identify all your entities before you even begin diagramming. Each entity should only appear in your diagram once. Otherwise, you’ll end up with different sets of attributes and relationships that inaccurately overlap or don’t connect at all. Avoid confusion by checking for duplicates and ensuring a single entity links to all relevant attributes.
4. Use modifiers to distinguish attributes
If you have entities with the same types of attributes, consider using modifiers to differentiate them. Let’s say your entities are patients, providers, and departments, and they all have the attribute’ Name.’ Use ‘Patient Name,’ ‘Provider Name,’ and ‘Dept Name’ to clearly identify each attribute.
5. Color-code ER diagrams for clarity
Using colors to code the layout of your diagram is helpful for quickly conveying different relationships. Once you establish which color represents a component, it’ll be easier to visualize the structure and associations of the data.
6. Check for redundancies and errors
Before finalizing a diagram, eliminate any elements that are repetitive or don’t follow a logical format. The cleaner and simpler the diagram, the more effectively it conveys your database structure.
For example, make sure no relationships link to one another; they should only connect entities. So, if you have relationships linking, you likely overlooked a weak attribute that should be included. Another possibility is that you attempted to map an entity’s state change, which doesn’t work well within this model.
ER diagrams vs. EER diagrams
Overall, both diagrams provide the ability to design your database with precision.
An ER diagram gives you the visual outlook of your database. It details the relationships and attributes of its entities, paving the way for smooth database development in the steps ahead.
EER diagrams, on the other hand, are perfect for examining information more thoroughly. When your database contains a large amount of data, it’s best to turn to an enhanced version to understand your model more deeply.
So, when should you use which? Honestly, both are useful, and it mostly depends on the size and detail of your data. The more complicated the data, the more likely you’ll need to use an EER diagram to make sure you’re properly organizing every relationship.
Both diagrams make designing your database easier than ever. All you need is a great diagramming tool that provides ready-made templates, shapes, and notations to create your ER and EER diagrams in a flash.
ER diagram examples
Let’s delve into practical illustrations of Entity-Relationship diagrams in action. In this curated collection, you’ll find a diverse range of ER diagram examples showcasing how entities, attributes, and relationships are represented visually in database design. Whether you’re a beginner seeking clarity or an experienced practitioner looking for inspiration, these examples offer valuable insights into modeling real-world data structures effectively.
ER diagram for library management system

ER diagram for hospital management system

ER diagram for college management system

ER diagram for banking system

ER diagram for hotel management system

ER diagram for railway reservation system

ER diagram for online shopping

ER diagram tools
Understanding the nuances between ER diagrams and EER diagrams is essential for anyone involved in database design and management. While both types of diagrams serve the purpose of visually representing the structure and relationships within a database, they differ in complexity and the types of relationships they can model.
By grasping the distinctions between ER and EER diagrams, database designers and developers can choose the most appropriate modeling approach based on the specific requirements and complexities of their projects. Whether it’s a straightforward relational database or a more intricate data model with inheritance and specialization, having a clear understanding of ER and EER diagrams ensures that the resulting database design accurately reflects the underlying data semantics and relationships.
Furthermore, embracing modern tools for diagramming can greatly enhance the efficiency and effectiveness of the database design process. Among these tools, Cacoo stands out as a versatile and user-friendly platform for creating ER and EER diagrams online. With its intuitive interface and robust feature set, Cacoo empowers users to effortlessly design, collaborate on, and iterate upon database schemas in real time.
Cacoo offers a rich library of pre-built shapes and templates specifically tailored for database modeling, making it easy to create professional-looking ER and EER diagrams without the need for advanced technical skills. Whether you’re a seasoned database architect or a novice designer, Cacoo provides the tools and flexibility you need to bring your database designs to life.
This post was originally published on March 9, 2018, and updated most recently on May 21, 2024.


