- All templates
- Planning & Management
- Gantt Chart Road Map
Gantt Chart Road Map

Uses of Gantt Chart Road Maps
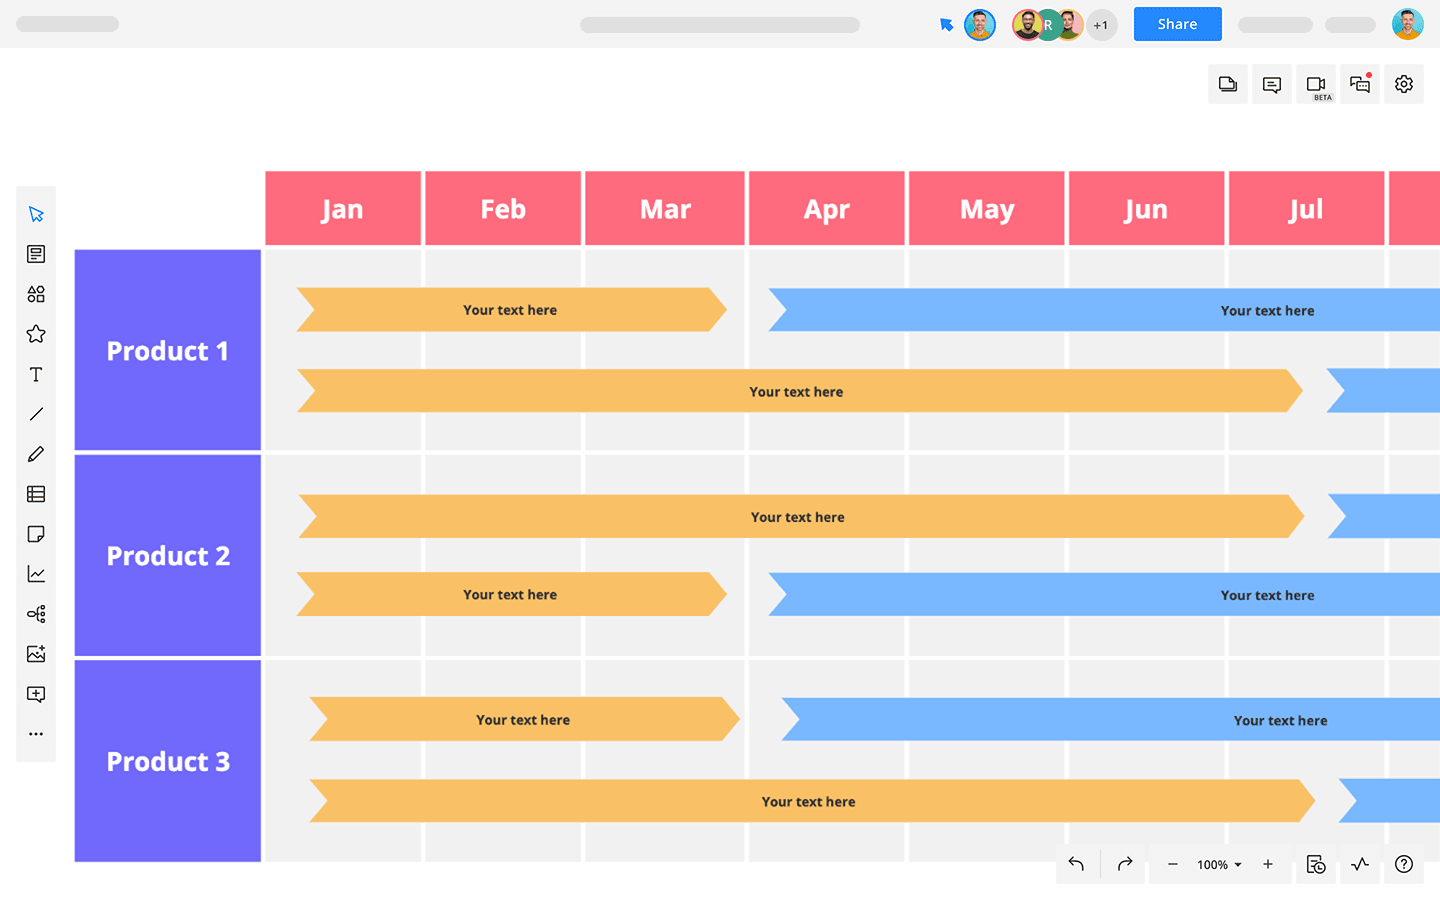
A Gantt chart is a simple bar chart frequently used in project management to illustrate a project schedule and the dependencies between activities. They can also show current project status.
So, what would you need a Gantt chart for?
Knowing what’s going on in your projects
Creating a simple chart with a timeline, dependencies, and resources gives you an overview of the project.
Avoiding resource overload
Being aware of the workload on each of your available resources can help you avoid burnout, bottlenecks, or misuse.
Improving time management
Charting project timelines and productivity gives you and your team a transparent look at how everyone is spending their time.
Increasing accountability
Showing the full project and its implications to the entire team gives everyone clarity about their roles and the impact of each project phase.
By involving your resources in defining timelines, you can increase accountability and cohesion inside your team. And the easiest way to get your team to work together on a Gantt Chart Road Map is to use Cacoo and its collaboration features.

How to create your own Gantt Chart Road Map
First of all, define the baseline. Consider your starting point and what you need to achieve.
Define the essential activities involved in your project. In other words, break down the baseline into more granular activities.
Establish the sequence of activities. What tasks need to get done before other activities can start, and what tasks can be done in parallel?
Evaluate necessary resources. Think about the resources you have, the duration of their availability, and any gaps you need to fill to complete the project.
Finalize your roadmap by laying out the details in the perfect Cacoo Gantt chart!
Related tags
You may also like


