- All templates
- Research & Design
- Timeline Infographic
Timeline Infographic

Uses of Timeline Infographics
A timeline infographic is a great tool for visualizing important milestones and deadlines within a project. It helps you map out phases, tasks, and dependencies, making complex schedules easy to understand and communicate.
During the project planning phase, a timeline infographic ensures everyone is aligned on deliverables and deadlines. It allows you to track progress at a glance, making it easier to adjust plans as needed. It can also be used to track long-term goals, ensuring that all tasks are completed on schedule.
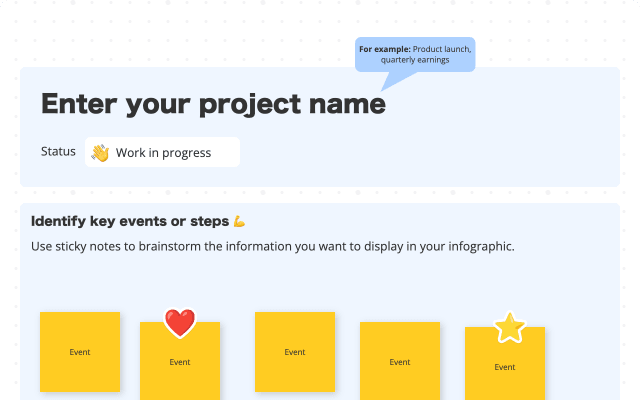
Using a customizable template, you can easily adapt the timeline to suit your needs. Add colors, icons, or annotations to enhance its visual impact and ensure your message resonates.
Our timeline infographic template provides a clean, easy-to-edit format to help you visualize your project’s progress and ensure that key milestones are achieved on time.

How to create your own Timeline Infographic:
Open the Timeline Infographic template in Cacoo.
Define the time period or sequence you’re visualizing.
Add key milestones, events, or phases along the timeline.
Use labels and brief descriptions to explain each point.
Enhance clarity with icons, color coding, or shapes.
Arrange the timeline to align with your audience’s preferences (horizontal or vertical).
Review to ensure accuracy and readability.
Share or embed the timeline in your presentation or document.
Related tags
You may also like


