
Creating a clear, well-structured diagram shouldn’t take hours — especially when you’ve got a client meeting on the calendar. Whether you’re building out a roadmap or preparing a slide deck, Cacoo helps you move from a blank canvas to a polished diagram, fast.
In this guide, we’ll show you how to get started fast using Cacoo’s built-in templates, easy editing tools, and real-time collaboration features. Let’s go!
Creating a new diagram
To start working in Cacoo, the first step is to create a new diagram. You have three quick options:
- Click “Create Diagram” at the top left corner of your Cacoo dashboard.
- Enter cacoo.new into your browser’s address bar to instantly launch a new diagram.
- Open the template library and select “Blank Diagram” to start from scratch.
Each option will bring you into the Cacoo editor, where you can begin building your diagram using drag-and-drop elements.
Using templates for faster results
While blank diagrams offer complete flexibility, starting with a template can save time and give your diagrams a consistent, polished structure.
How to use a template:
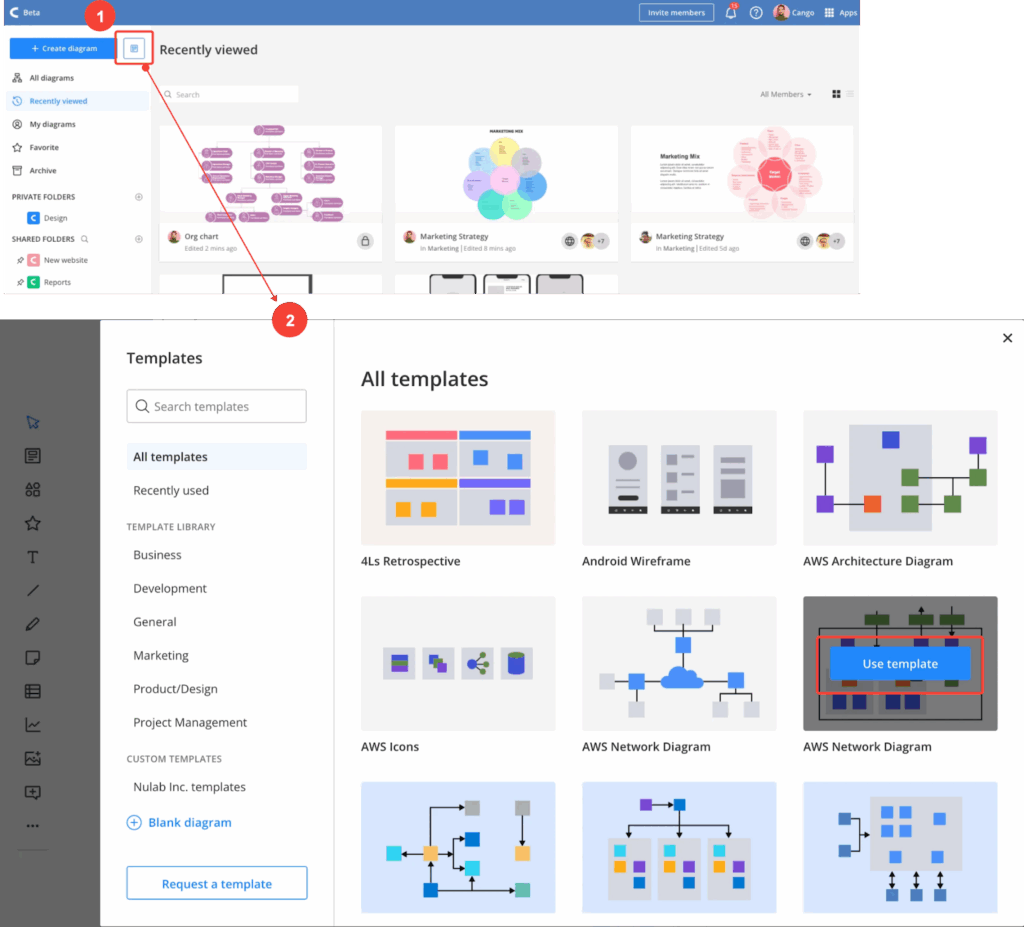
- From the dashboard, click the template icon in the top-left sidebar. This opens up the template library, where you’ll find everything from bar charts to flow diagrams.
- Browse the template library by keyword or category. Categories include brainstorming, business presentations, system architecture, and more.
- When you find a suitable template, hover over it and click “Use template.”
Templates are fully customizable. You can remove any placeholder content and replace it with your own text, shapes, charts, or tables. You can also change color and size for a fully personalized result.
Pro tip: Are you a project manager, sales manager, or team leader? Try the Business Presentation template for quick, client-facing slides. You can combine it with other diagrams or create a full deck within Cacoo.
Organizing and naming your diagrams
As your library of diagrams grows, keeping things organized will help you save time and stay focused. Every diagram you create is automatically saved to My Diagrams, but you can rename and categorize them for better access. This is extra-important if you are working as part of a team.
To name your diagram:
- Open the diagram.
- Click the title at the top (it will default to “New Diagram”).
- Type your desired name.
- Press Enter or click anywhere in the canvas to save the change.

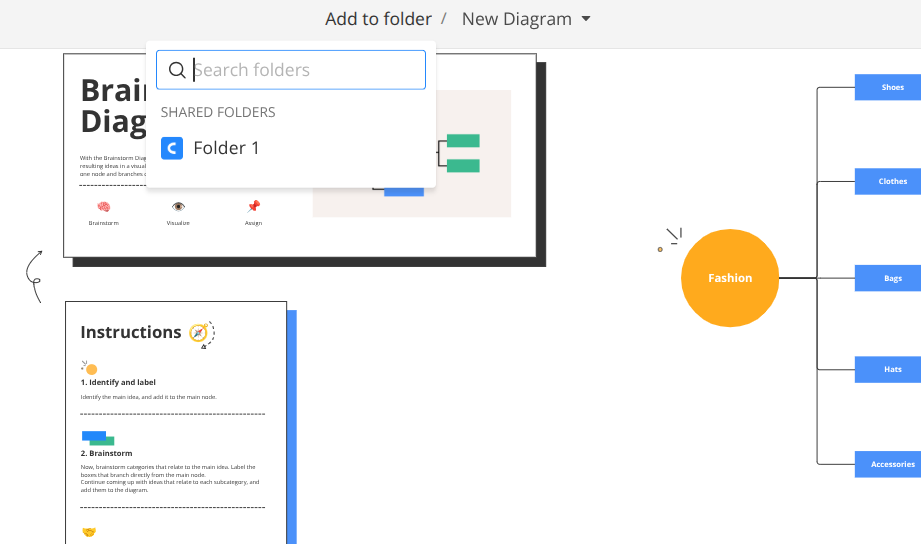
To move a diagram to a folder:
- Open the diagram.
- In the top navigation bar, click “Add to folder.”
- Choose an existing folder or create a new one (note: you can create new folders via the dashboard. Once you have created the folder, return to your diagram. You will now be able to add it).
Pro tip: Use consistent naming conventions for client work (e.g., “ClientName_ProjectName_Quarter”) to stay organized and enable speedy searching.
Adding charts and tables to your diagram
Once your structure is in place, you can enhance your diagram with charts and tables. This is especially helpful for bringing clarity to product roadmaps, timelines, KPIs, reports and more.
How to add a chart
- Click the chart icon in the tool menu.
- Choose a chart type (bar, pie, line, scatter, etc.).
- Click the whiteboard to insert the chart.
Inputting data:
There are two ways to do this: manually and by importing. Here’s how to do each one.
- Manually:
- Select the chart you want.
- Click the pencil icon in the editor menu to open the data table.
- Double-click any cell to edit the data.
- Importing data:
- In the chart data table, click the import icon.
- Click the pencil icon in the editor menu to open the chart data.
- Choose Excel/CSV or Google Drive, then select your file.
Editing and customizing charts:
- Reorder rows and columns via drag and drop.
- Edit chart headers, axis titles, and legend items directly.
- Adjust chart type, colors, and visibility settings using the settings (cog) icon.
Pro tip: Use color and chart type consistently throughout your presentation to create a visually cohesive experience.
Migrate outdated charts
If you created charts in Cacoo pre-2022, then they’re no longer editable unless you migrate them. To do that:
- Double-click the chart to open the “Migrate as new chart” panel.
- Select “Migrate my chart.”
- “Keep copy of legacy chart” is selected automatically.
- This means a copy of your old chart will be saved.
- If you deselect it, the old chart will be deleted.
- After migration, you can go back to the old chart by choosing “Back to legacy” in the chart settings panel.
- This option is only available right after migration — it disappears if you reload or close the diagram.
How to add a table
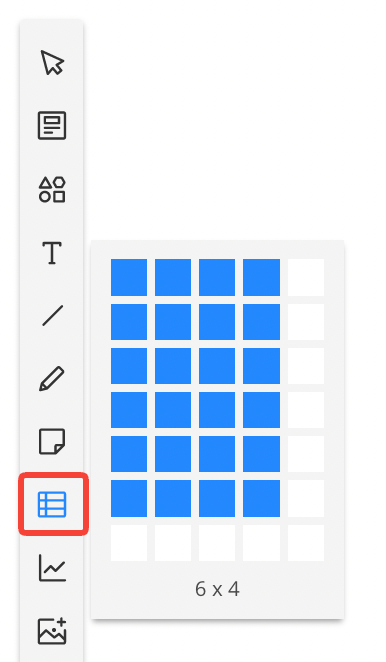
- Click the table icon in the tool menu.
- Select the number of rows and columns.
- Click to place the table into your diagram.
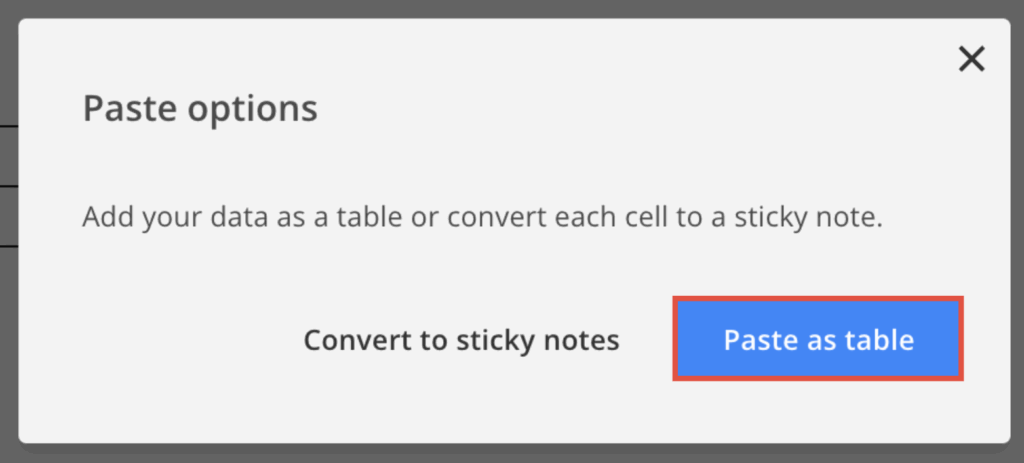
You can also paste in a table from Excel or Google Sheets:
- Prepare a 2×2 (or larger) table in your spreadsheet.
- Copy the content and paste it into Cacoo using Ctrl + V (Cmd + V on Mac).
- When prompted, select “Paste as table.”
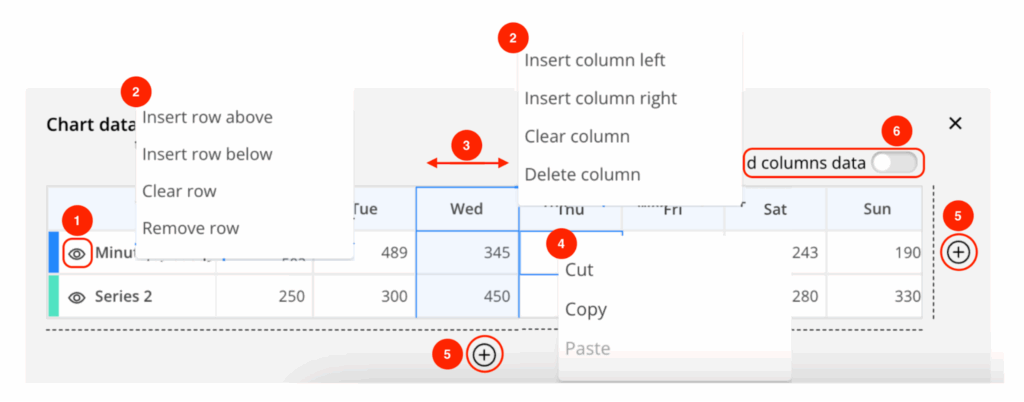
Editing a table:
- Add rows or columns by clicking the “+” icons next to the cells.
- Merge cells, adjust fill color, and change line styles via the editor menu.
- Drag the diamond icon to reposition the table.
Pro tip: Keep tables simple and readable. Avoid overcrowding cells with too much text or data.
Sharing and presenting your diagram
Once your diagram is ready, you can share it with colleagues or clients directly from Cacoo. Cacoo supports real-time collaboration and in-app video chat — perfect for walkthroughs and presentations.
To share your diagram:
- Click the “Share” button in the upper right.
- Invite collaborators by email or generate a shareable link.
- Set permission levels (view or edit).
To present via video chat:
- Start a video chat from within the diagram.
- Click the “Start screen sharing” button at the bottom of the screen.
- Select the screen or window you want to share.
- Click “Share.”
To stop screen sharing:
- Click the “Stop screen sharing” button at the bottom.
If someone else is presenting and you need to take over:
- Click “Start screen sharing” and select “Share now.”
The current presenter will be notified that their screen share has ended.
Pro tip: Minimize your shared screen to view it in the side panel. This doesn’t affect what others see!
To follow teammates:
You can also use Follow mode to keep everyone on the same page during team collaboration.
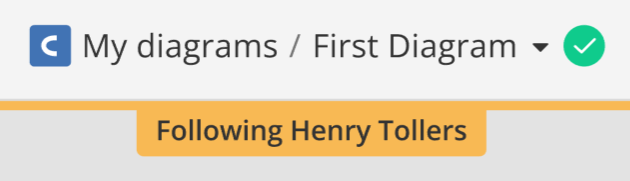
- Select a teammate’s avatar to follow their view in real time. A colored frame will appear with “Following [name]” at the top of your screen.

- To invite others to follow you, hover over your avatar and choose “Follow me.” Active collaborators will receive a notification to join your view.

- To stop following or being followed, click “Stop” at any time.
Pro tip: Follow mode is perfect for guiding others through a diagram without needing to share your screen.
Best practices for clean, professional diagrams
To create clear and client-ready diagrams, keep these best practices in mind:
1. Start with a goal
Before adding elements, identify what the diagram needs to communicate. Are you visualizing a process? Presenting data? Mapping features? Every decision you make should be geared toward this.
2. Use alignment tools
No need to count pixels. Cacoo offers smart guides to help you align shapes and text. Use them to create a tidy layout with even spacing and consistent sizing.
3. Limit colors and fonts
Stick to 2–3 colors and a single font to maintain visual consistency. Avoid cluttered designs or bright, distracting color schemes.
4. Label clearly
Use clear, concise labels for every element. Avoid vague terms and ensure the viewer can understand the diagram at a glance.
5. Keep it scannable
If you’re creating a presentation or flow, structure your diagram so it reads from left to right or top to bottom.
Pro tip: Save time by creating your own reusable templates for frequently used diagrams.
Final thoughts
Creating clean, client-ready diagrams doesn’t have to be time-consuming. With Cacoo, you can:
- Start quickly with a blank canvas or a template
- Add professional visuals like charts and tables
- Organize and name your work for easy access
- Share and present seamlessly — all within the platform.
By following these steps and best practices, you’ll be well on your way to creating diagrams that communicate clearly and make a great impression.
About Author

Georgina Guthrie
Guest authorGeorgina is a displaced Brit currently working in France as a freelance copywriter. Before moving to sunnier climates, she worked as a B2B agency writer in Bristol, England, which is also where she was born. In her spare time, she enjoys old films and cooking (badly).


