
Multitasking is difficult. In fact, it’s so difficult, that our brains can’t really do it. But, as a project manager, it’s your job to look after a variety of tasks — which often means handling several tasks simultaneously. It’s not easy, and letting one thing slip could have disastrous consequences on the overall project. Luckily, there are plenty of techniques designed to take some of the strain off your brain — but one of the easiest and most accessible are Gantt charts.
Gantt charts are for anyone who needs to get an instant view of a project timeline. A major benefit is that they’re a visual way to display lots of information at once, which makes it more memorable and easier to digest. We may not be very good at multitasking, but we can handle various visual functions simultaneously — without having an adverse effect on productivity. So the more diagrams you have at your disposal, the better.
What is a Gantt Chart?
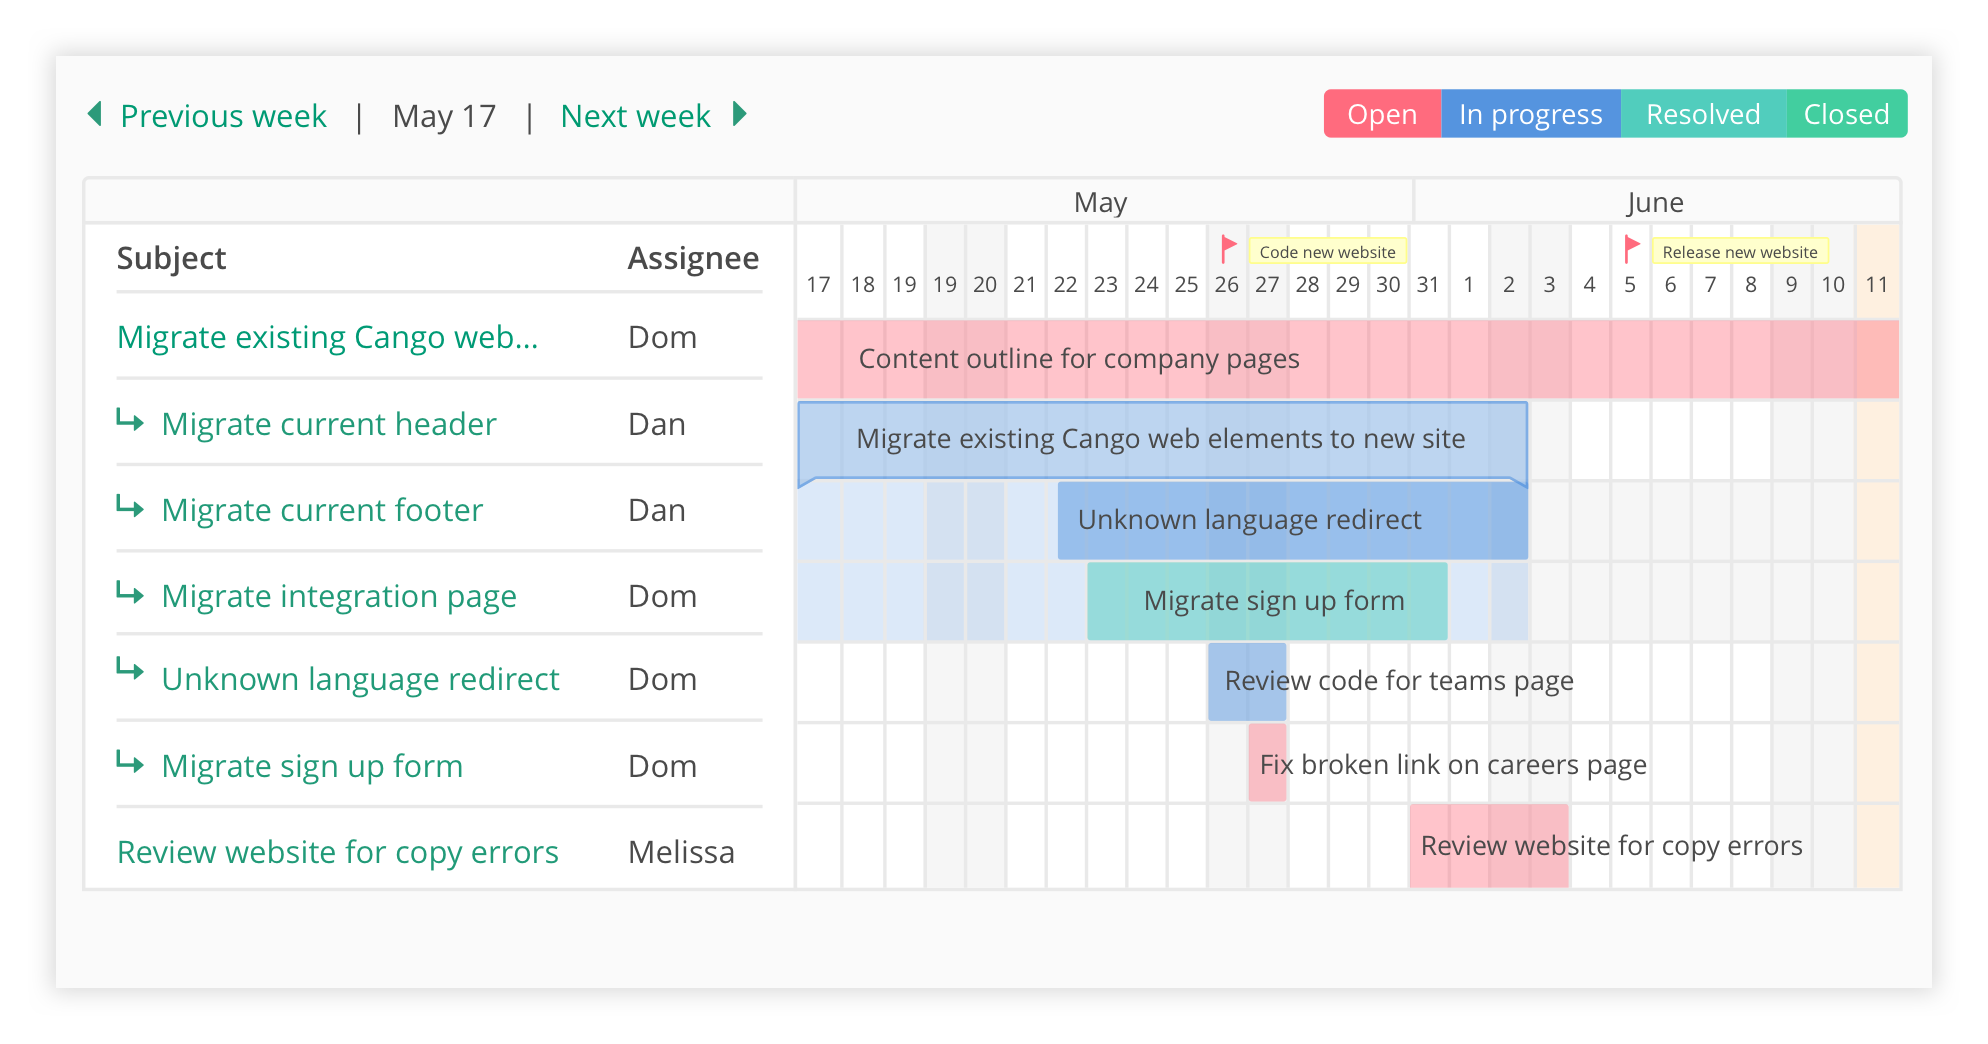
A Gantt chart is a timeline that breaks projects down into smaller tasks with dates to show durations and start/finish times. It looks like a series of horizontal blocks that stretch across a calendar.
5 ways you can use your Gantt chart
Once you’ve created your chart, you’ll be able to report on your tasks and teams throughout the project. Below are just a few of the ways you can use your new tool.
1. To adjust your workflow
You can use your Gantt charts to map out the different project and task scenarios, including start/end dates and duration — and then adjust workflows accordingly. You can also use it to work out overlaps and task dependencies.
2. To define your critical path
Combining your chart with the Critical Path Method (CPM) can help you work out your overall project start and end date. You can also refer back to it to make sure you’re on target.
You’ll find your critical path by identifying the longest stretch of activities that will take the most time. Work out how long it’ll take to complete every single task in this stretch, from start to finish, and presto: You have your critical path.
3. To make projects easier to digest
Big tasks can be daunting. Breaking them down into smaller chunks (or sprints) can help you complete work more efficiently. Accomplishing lots of smaller tasks will also make progress feel more tangible and boost morale.
4. To set accurate deadlines
Make it a habit to schedule or reschedule tasks for a project directly on your Gantt chart. By doing so, you’ll see how even tiny schedule changes affect the overall timing of the entire project — which leads to more precise planning and accurate deadlines.
5. To monitor project progress
Being able to see how small changes have an impact on the larger project can lead to more accurate planning and scheduling. Presenting information visually makes it easier for you to take in information at a glance, which in turn, makes it simpler for you to stay on top of tasks and progress.
How to create your Gantt chart
1. Choose your tools.
Will you use project management software, an online diagramming tool, or an Excel spreadsheet? All are fine, but as a general rule of thumb, you should only use spreadsheets when you personally are the only one using the chart. If more people need to be involved, then you’ll start facing issues like version control (people might make changes without telling the team), access (only one person can view the doc at a time), and updates (you’ll have to manually make adjustments and update task progress).
An online version means you don’t need to worry about any of these things because it’s cloud-based, and if it’s part of your project management tool, it should update automatically — which means one less thing for you to think about.
2. Break your project down into tasks.
Start with the big activities, then drill down into smaller tasks. Work out the order in which each stage will need to be completed, as well as the duration of each one. If this is your first ever Gantt chart, you may want to keep it simple with top-level items before becoming more granular later on.
3. Add tasks.
Populate your diagram with blocks. Each block represents a task. The beginning of this block represents the start date. How long the block stretches horizontally across the chart indicates task duration, and the point at which the block ends represents the finish. Don’t forget to name each task, and add notes about who will be working on each item.
4. Designate timeframes.
Work out how long it’ll take to complete each task as accurately as possible. As you extend task time, each bar will extend across your diagram accordingly. Now you can see overlaps, as well as team/individual availability.
5. Customize your chart.
If you’re working with multiple projects or teams, it’s a good idea to customize your chart to make it easier to distinguish between each one. Colors are a good place to start — as well as clear labeling. Some people like to assign each individual a color, while others prefer to use different shades to represent task statuses or project phases. Do what works best for you.
6. Collaborate with your team.
If you’re using a cloud-based project management tool, you can all work on the same chart at the same time. Changes will reflect across your team in real time. And you can use targeted notifications to keep the right people in the loop at the right time.
When to use a Gantt chart vs. Kanban
With such a useful model to create and manage tasks, why would any other version exist? Another extremely popular task-tracking visual is Kanban boards, which present ongoing tasks in columns depending on what stage of the completion process they’re in.
So which do you use, the Gantt chart or the Kanban board? That entirely depends on the setup of your project.
Gantt charts are better in situations that:
- Have dependencies, so you can what tasks need to happen in what order.
- Require roadmapping, so you and your team can easily view what the entire project, including deadlines, looks like.
- Prioritize tasks, so you can easily manage priorities.
Kanban boards are better in situations that:
- Have a singular focus. If you’re not a manager and just need to complete one part of the project on time, a Kanban view might be for you.
- Might change. Kanban is easier to adjust on the occasion that a lot of details of the project could shift.
To learn more about Kanban and discover their differences for yourself, check out the great guide we’ve put together to get you through the basics.
Gantt chart software
Gantt charts are a project management essential. They simplify timelines and convey lots of crucial information in one simple visual.
Never underestimate the benefit of having the right tools for the job. Choose quality project management software that lets you track updates, measure progress, and share information with your team in real time. This way, you can keep a firmer grip on developments, adapt more effectively, and leave all that productivity-sapping multitasking to the software.
This post was originally published on December 4, 2019, and updated most recently on May 26, 2021.
About Author

Georgina Guthrie
Guest authorGeorgina is a displaced Brit currently working in France as a freelance copywriter. Before moving to sunnier climates, she worked as a B2B agency writer in Bristol, England, which is also where she was born. In her spare time, she enjoys old films and cooking (badly).


