
Effectively planning and managing complex business projects has always been a challenge. It’s not easy to ensure everyone understands their responsibilities and executes them at the right time, in the right order. On top of that, goals and deadlines constantly shift, making it extremely difficult to estimate project durations and resource requirements.
Without the proper project management framework, teams lack visibility into critical paths and task dependencies. This inability to monitor project progress can cause teams to fall behind deadlines and become misaligned, ultimately leading to important projects grinding to a halt.
Effective project management is key. Only by pairing the right project management frameworks with the right tools can project managers eliminate these woes and build a working environment that empowers teams to crush their goals.
Among the most important of these frameworks is a Program, Evaluation, and Review Technique chart, or as it’s more commonly known, a PERT chart. PERT charts are graphical representations of a project that summarizes its timeline, discrete tasks, and dependencies.
Meet Cacoo: Online PERT chart software
PERT charts are easily created with online diagramming tools. One such tool is Cacoo: a popular online diagramming tool that enables project managers to quickly and effectively create and share PERT charts.
Cacoo is used by over 2 million people around the world and comes with a wide range of project management features for small tech teams and developers, from dozens of pre-built templates to seamless collaboration features. You can try Cacoo for free today.

Using this tool, we will walk you through creating your own PERT chart. We’ll explain how to use PERT charts to effectively manage project timelines, critical paths, and resources and then share a series of practical tips that will help you use PERT charts to drive improved collaboration on complex projects.
What is a PERT chart, and why use it?
PERT charts break down complicated issues into a series of smaller tasks to help schedule, organize, and map out the steps that must be completed for a project to be accomplished. They’re similar to Gantt charts but function more like a diagram than a linear chart, displaying the relationships between different tasks.
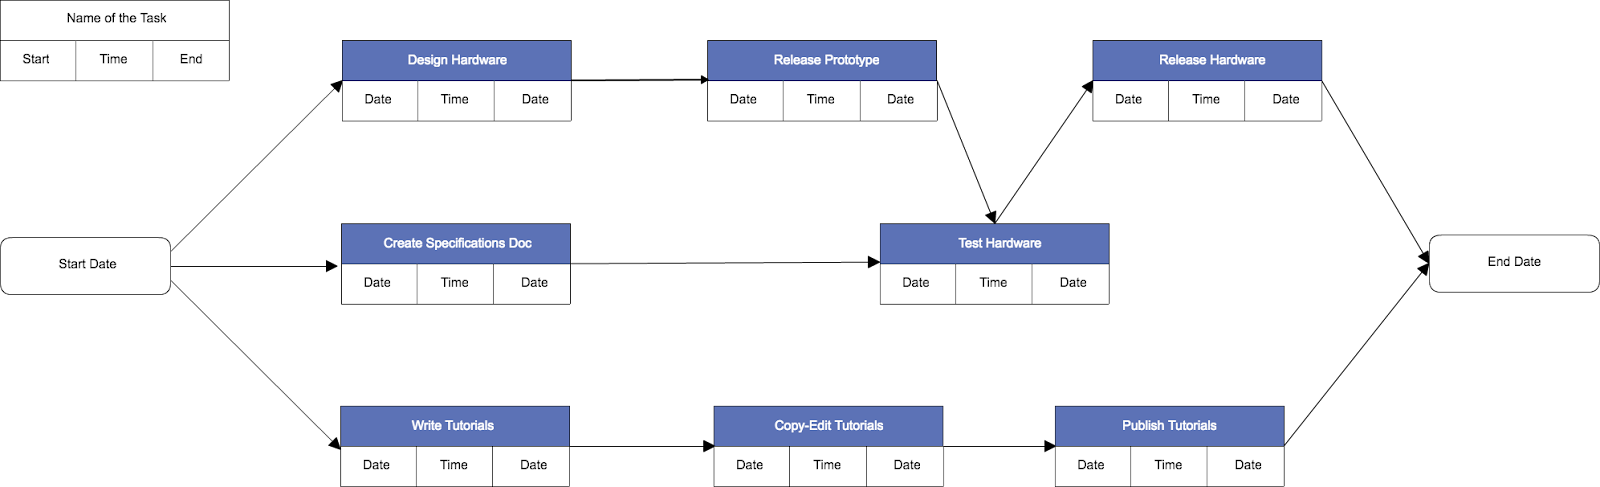
PERT charts are made up of nodes, arrows, numbers, and dummy activities. Below, you’ll see an example PERT chart.
Each orange box is a node representing a specific project event. The arrows represent the sequence of events. In the example below, the ‘Design Hardware’ task must be completed before the ‘Release Prototype‘ task can begin.
Tasks that are not connected by arrows, but occupy the same point on the project timeline, can be completed simultaneously. In the below example, the ‘Design Hardware’ and ‘Write Tutorials’ tasks can be worked on at the same time.
PERT charts are an extremely useful project management tool, providing the entire team with a clear overview of a project’s scope, dependencies, and timeline. This fosters increased levels of communication and collaboration, building alignment between individuals and teams working on discrete elements of the wider project.
Without the right software, creating and managing PERT charts can be time-consuming and complex. However, with the right approach, they’re a highly effective project management tool that supports better decision-making and problem-solving. And with tactics like the PERT chart analysis, they can help you improve your workflow over time.
How to create a PERT chart in Cacoo
It’s easy to create your own PERT chart in Cacoo, even if you’ve never built one before. Among Cacoo’s dozens of diagramming templates, you’ll find a PERT chart template that has everything you need to get started.
Below, we’ll walk you through how to create and customize your PERT chart using this template.
Sign up for a free Cacoo account and follow along with the steps below. In just a few minutes, you’ll be well on your way to creating a PERT chart that will help you manage your next project much more efficiently.
Step 1: Define the project scope
Before you start the process of creating a PERT chart, take the time to think through your project in a little more detail. A PERT chart is only as good as its inputs, so it’s vital to clarify the project’s scope before starting to design your chart.
Consider the objectives, deliverables, and stakeholders of your project. It’s often helpful to touch base with other members of your team to get their input and build a joint vision of what success looks like.
Step 2: Identify major milestones
A PERT chart is organized using a series of major milestones or events, each of which acts as checkpoints for the progress of a project. Exactly what these look like will depend on your project, but let’s look at a simple example.
A development team is working on introducing a new feature to a cloud-based web application. Their major milestones for the project might include the following:
- Complete customer journey mapping
- Wireframe new feature screens
- Release prototype
- Test prototype
- Resolve bugs and performance issues
- Launch new feature
Complex projects can have a dozen or so milestones, whereas simpler projects might just have a few.
Step 3: List the tasks required to complete each milestone
Each milestone in your project comes with a series of smaller tasks that must be completed. Let’s stick with our example from above. For the “Wireframe new feature screens” milestone, tasks the team must complete might include graphic design, copywriting, review processes, and more.
Step 4: Estimate the time and resources required for each task
Each of these smaller tasks will take a certain amount of time and use up specific resources. Work with your project’s stakeholders to identify the requirements for each task. You’ll use this information in your timeline when you start building your PERT chart.
Step 5: Map the dependencies and relationships between milestones
Many of the tasks in your project will have dependencies on each other. In our hypothetical example of the development team working to ship a new feature, the prototype cannot be tested before it is released. In other words, the testing milestone is dependent on the release milestone.
Mapping these relationships is critical to specifying the order in which tasks must happen. PERT charts are particularly useful in that they allow for tasks without dependencies to be completed simultaneously on different critical paths. This allows different functions, such as development and marketing, to each work on their own critical paths toward successfully launching the new feature.
Step 6: Set up your PERT chart in Cacoo
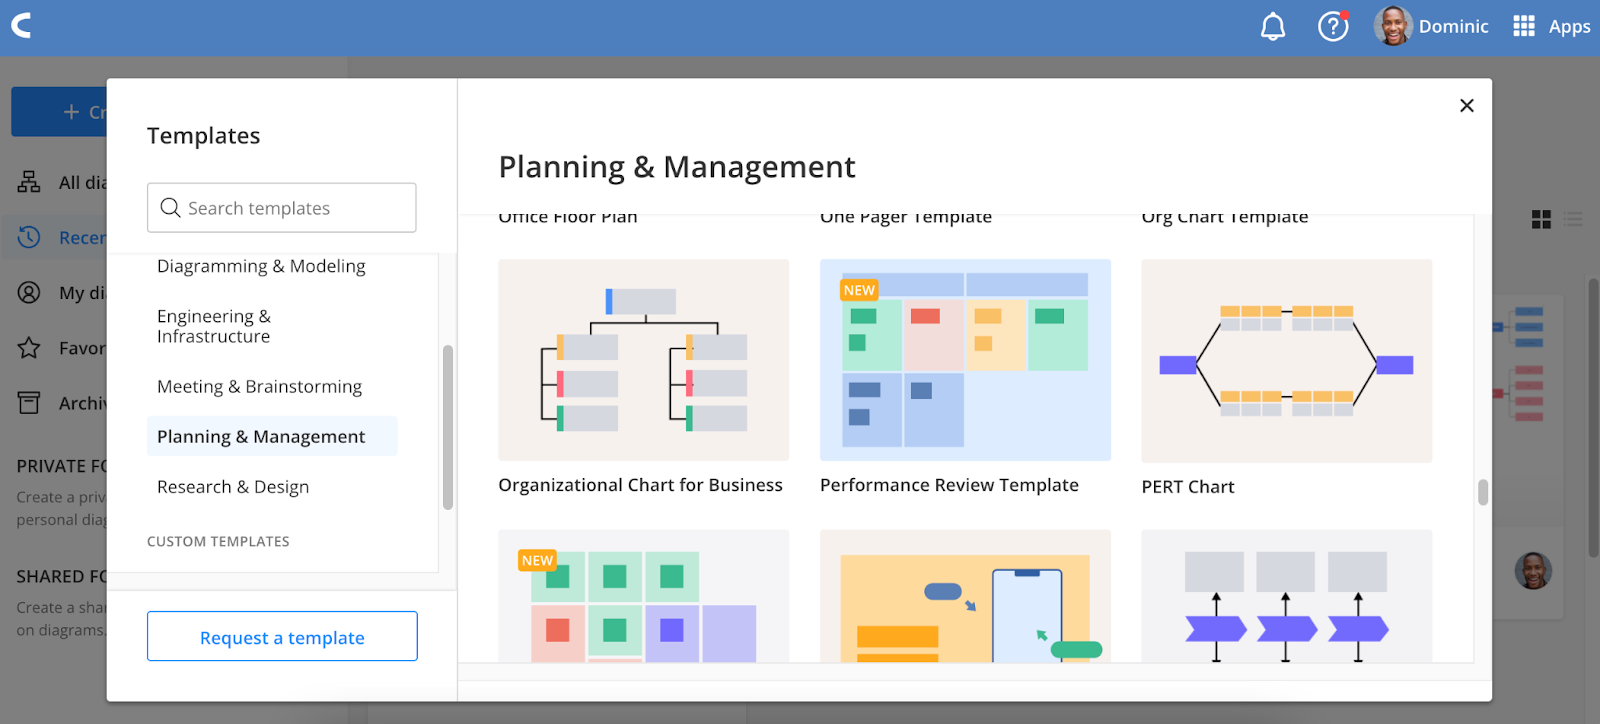
By now, you’ve completed all the planning steps that enable you to create an effective PERT chart. From your Cacoo dashboard, click on templates and then select the PERT chart template.
Get started by giving your project a name and filling in the start and end dates.
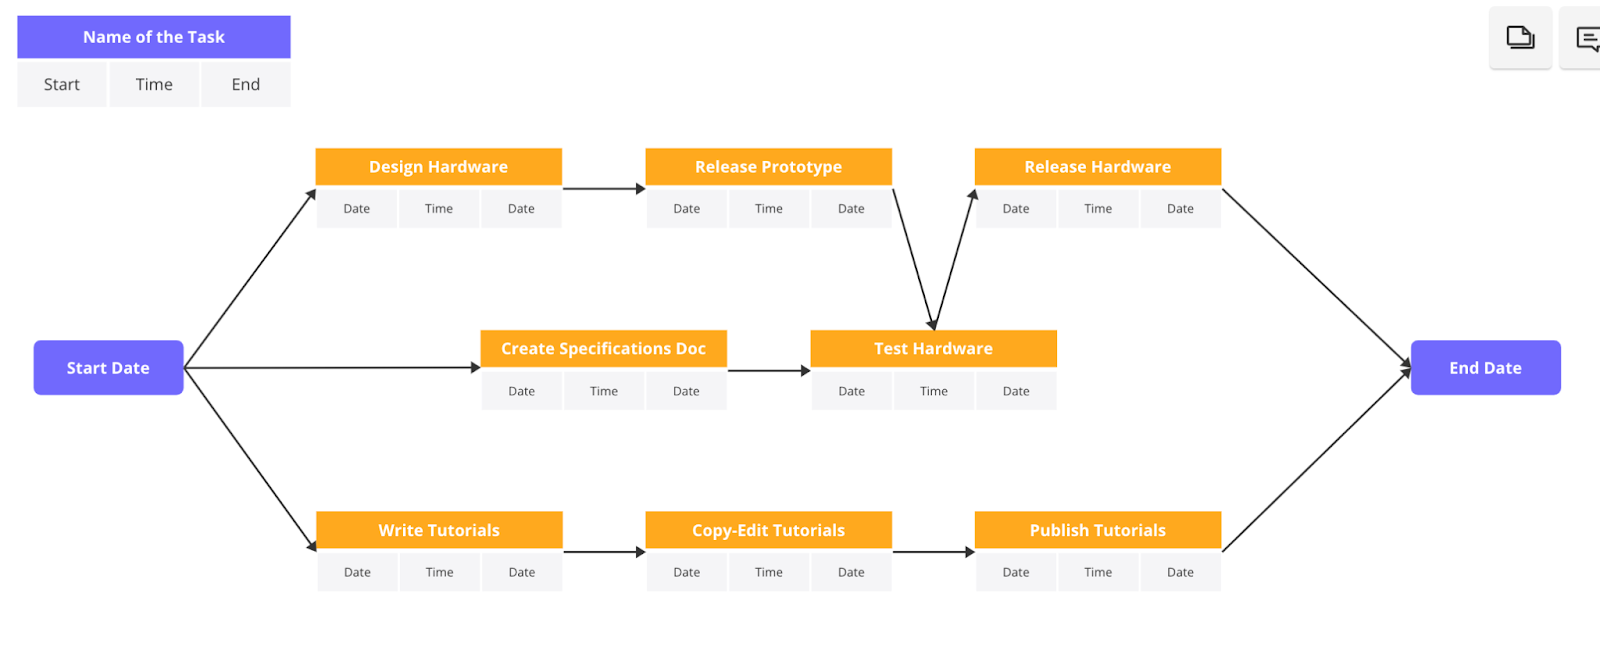
Step 7: Filling in the PERT chart
Starting on the left side of your PERT chart, fill in all the details your team needs to know about each project milestone. Add milestone names, dates, and time details.
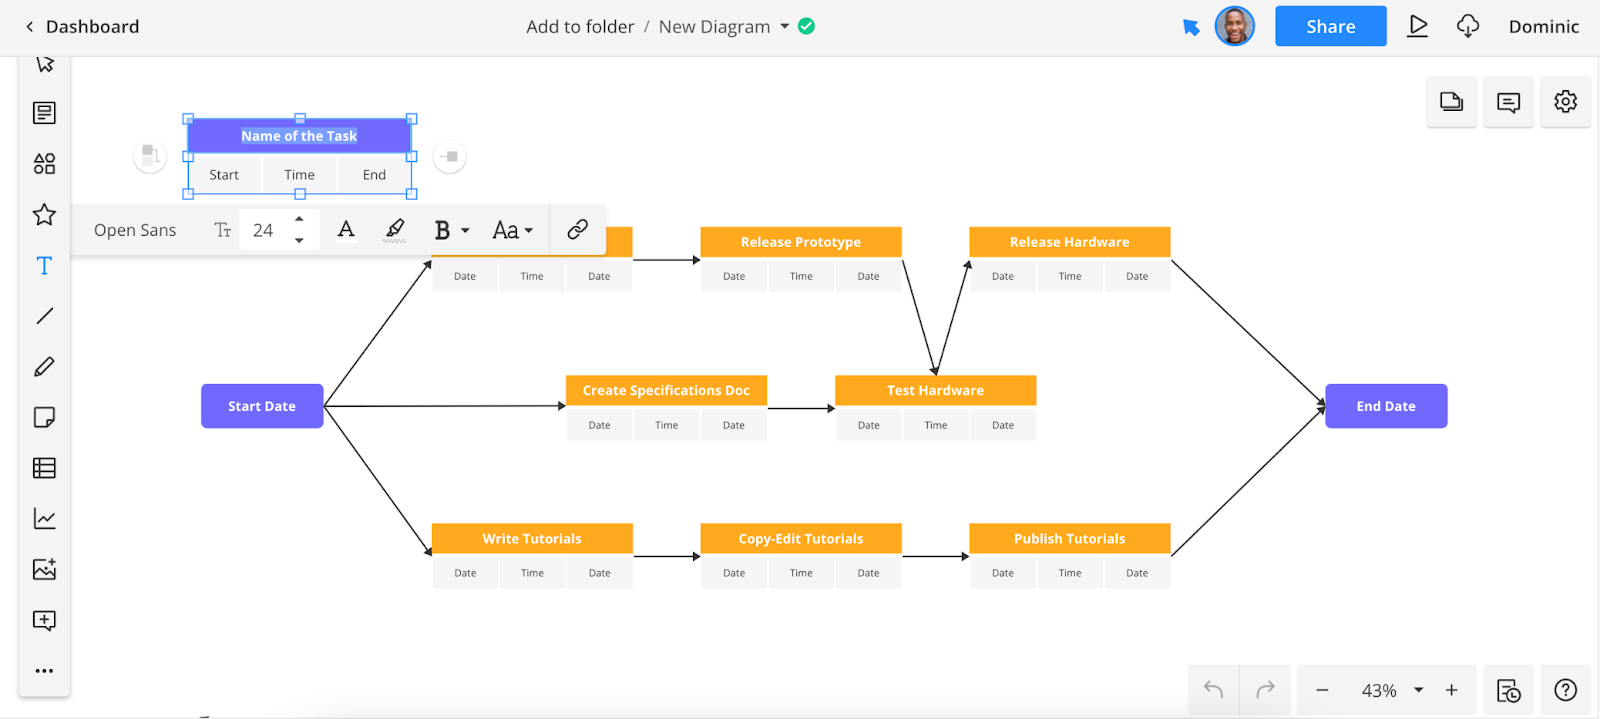
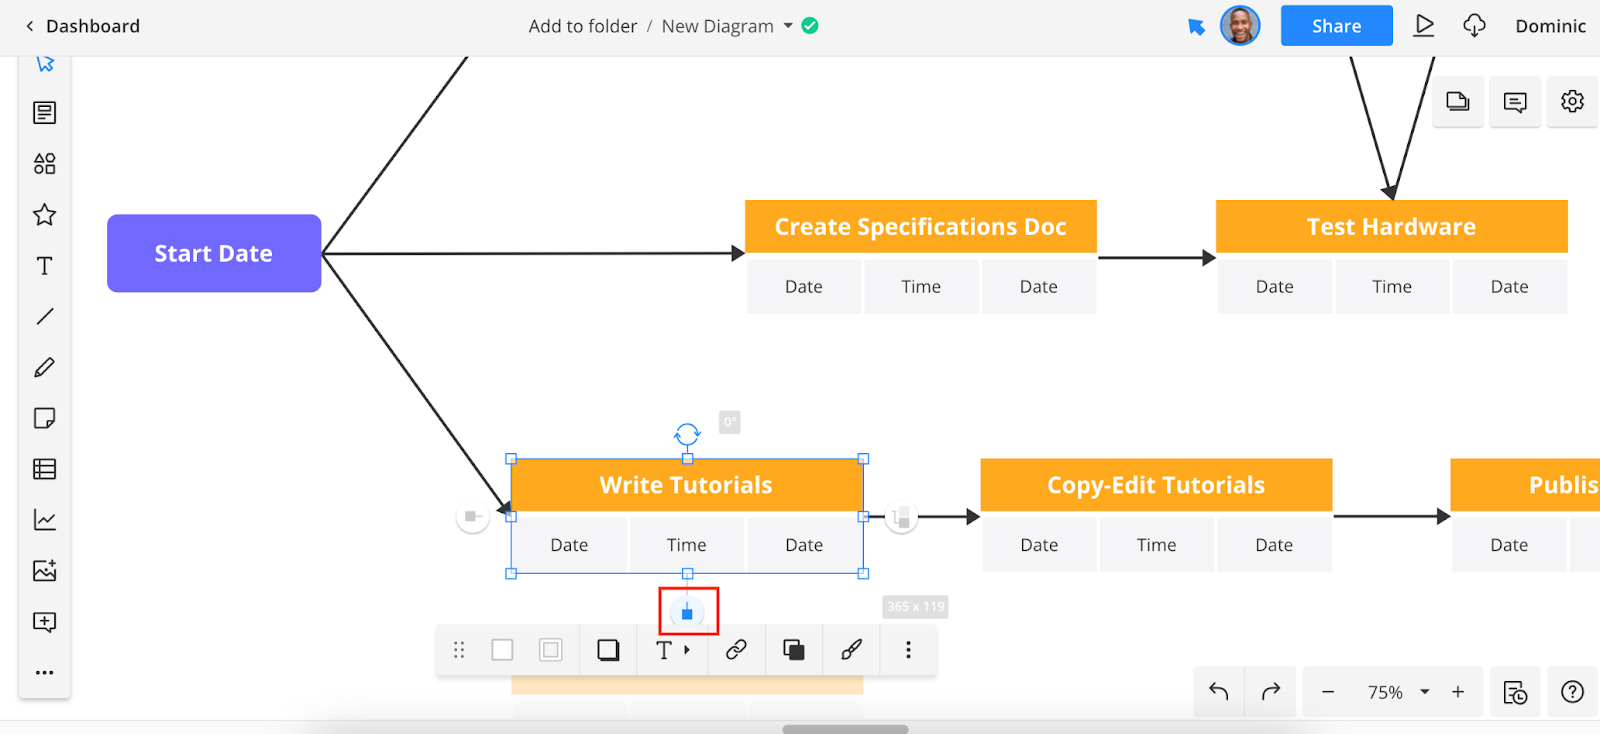
If you need to create sub-tasks for each milestone, it’s easy to add new sections to your PERT chart under each major milestone. Simply select a milestone and click on the icon highlighted in red to create a new node on your PERT chart.
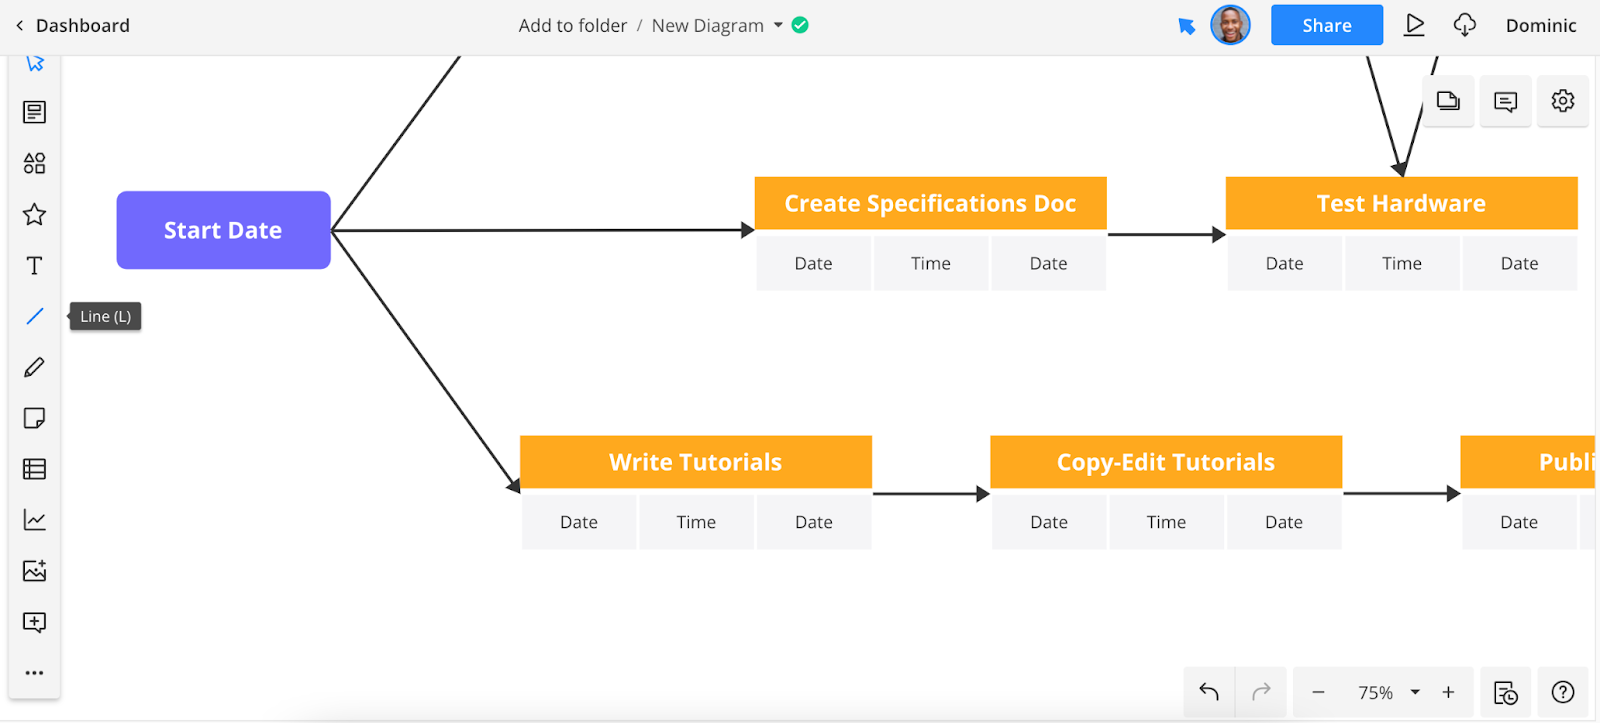
You can also re-draw the arrows in the template to better illustrate the relationships between the tasks in your project. Simply drag and drop existing arrows, or add new ones by clicking the Line icon in the taskbar to the left of the screen.
Step 8: Customize the PERT chart
Make your PERT chart your own by adding custom labels, colors, shapes, and icons.
Popular ways to customize your PERT charts include adding your company’s branding and color-coding different tasks to denote the department responsible for them.
Step 9: Share the PERT chart
For a PERT chart to be an effective project management tool, it needs to be visible to everyone involved in the project. In Cacoo, you can invite users to view the PERT chart by sending them an invite. Alternatively, you can export or print the chart and share it with your team offline.
The finished chart displays the project’s critical path, making it easy for everyone to understand which tasks are the most important for the project to be completed on the specified timeline.
Step 10: Revise the PERT chart
A PERT chart is a living document. Over time, as the project progresses and evolves, elements of your plan will change. When they do, update the PERT chart directly in Cacoo, ensuring everyone is always looking at the most up-to-date project plan.
How to use a PERT chart to plan and manage your projects
PERT charts are a great project management tool, enabling project managers to plan and oversee their projects more effectively. The key benefits of using PERT charts include the following:
- Better project estimates: PERT charts make it easier for managers to set realistic deadlines based on the various milestones that make up a project.
- Superior prioritization: PERT charts use the critical path method, helping project stakeholders easily identify the most important tasks and events in a project.
- Improved resource allocation: a PERT chart clearly displays which tasks require resources and which don’t, making it easy to assign tasks to stakeholders based on their skills and availability.
Cacoo makes it easy for project managers to manage their projects more effectively. Teams can access their PERT charts right from their Cacoo dashboard, and project managers can grant certain team members the ability to edit the PERT chart as the project progresses.
Cacoo also has a wide range of powerful collaboration tools that help teams work together seamlessly. These include chat, video chat, and commenting features that users can access directly from Cacoo without switching to a different tool. To share PERT charts with users outside of Cacoo, project managers can leverage integrations with tools such as Google Drive and Backlog or export their PERT charts in a variety of formats, like PDF and PPT.
Start creating PERT charts in Cacoo today
Its clear PERT charts are a precious project management tool, enabling leaders to distill complex projects with multiple paths and dependencies into a simple visual diagram that everyone can align on. For small tech and development teams with limited resources, PERT charts offer a structured approach that prioritizes key activities that must be accomplished.
PERT charts are useful in allowing project managers to better estimate project durations by creating clear timelines for individual milestones within a project. They also enable teams to identify critical paths within projects and allocate appropriate resources toward ensuring that activities on the critical path are not delayed.
Without the right software, creating and maintaining a real-time, up-to-date PERT chart can be difficult. But with Cacoo’s online diagramming tool, building a PERT chart is a breeze. With a pre-built PERT chart template and powerful customization and collaboration tools, project managers can create and share PERT charts easier than ever.
Ready to try it out for yourself? Get started with Cacoo for free today.
About Author

Cacoo Staff
Guest authorCacoo by Nulab is the collaborative diagramming software for modern teams. Use it for project diagrams, workflow planning, brainstorming, online whiteboarding, presentations, and more to keep your team on the same page.


