
If you’re in charge of a project, no matter how big or small, you need a project plan. Project planning is a central component of the broader field of project management, helping leaders outline and track the various tasks their team needs to accomplish for a project to be completed.
You can think of a project plan as a roadmap. Before work begins, your project plan shows the way to success: detailing what has to get done, by who, and by when. Once work starts, you’ll check these milestones off your list, gradually charting progress toward the successful completion of the project.
Project planning is of particular importance for tech companies. Planners in these companies must coordinate a diverse range of professionals – developers, designers, marketers, and more – to complete complex, highly technical projects.
Creating a visual representation of your project is key to keeping everyone aligned on the project’s progress. And when it comes to visual representations of projects, few tools are better than Gantt charts: a simple graphical display that documents the completion of work against a predefined schedule.
The challenges of project planning in tech
Project planners at tech companies face no shortage of challenges, both in proactively planning their projects and in managing live projects with countless moving parts.
As leaders, project planners have to manage all kinds of competing priorities. Design teams might favor a beautiful, graphics-heavy design for a new feature, whereas development teams looking to optimize load times might prefer a simpler approach. Project planners find themselves squarely in the middle of this and must navigate these challenges to keep everyone aligned.
Speed is also a major challenge. Tech companies move fast – but often, successful projects take time. Planners have to create and manage a schedule that ensures every task gets done to the right standard as fast as possible.
Other challenges, such as scope creep and a lack of communication between different teams, can combine to make the life of project planners extremely difficult.
These challenges are only worsened if a project planner doesn’t have the right tools for the job. Project planning software plays a key role in helping project planners address the challenges they face and oversee their projects toward a successful conclusion.
The power of Gantt charts in project planning
Gantt charts are an extremely useful tool in project planning, providing a simple visual representation of the project’s progress. They’re designed to be easy to understand, summarizing significant amounts of important information in a simple visual format.
Most projects consist of a series of smaller tasks, often handled by different individuals. Over the course of weeks or months, these individuals work together, completing their tasks on schedule so that other team members can start working on sequential tasks.
A Gantt chart displays this project timeline visually, outlining all of the critical tasks of a project, the date they should be completed by, the owner of each task, and more.
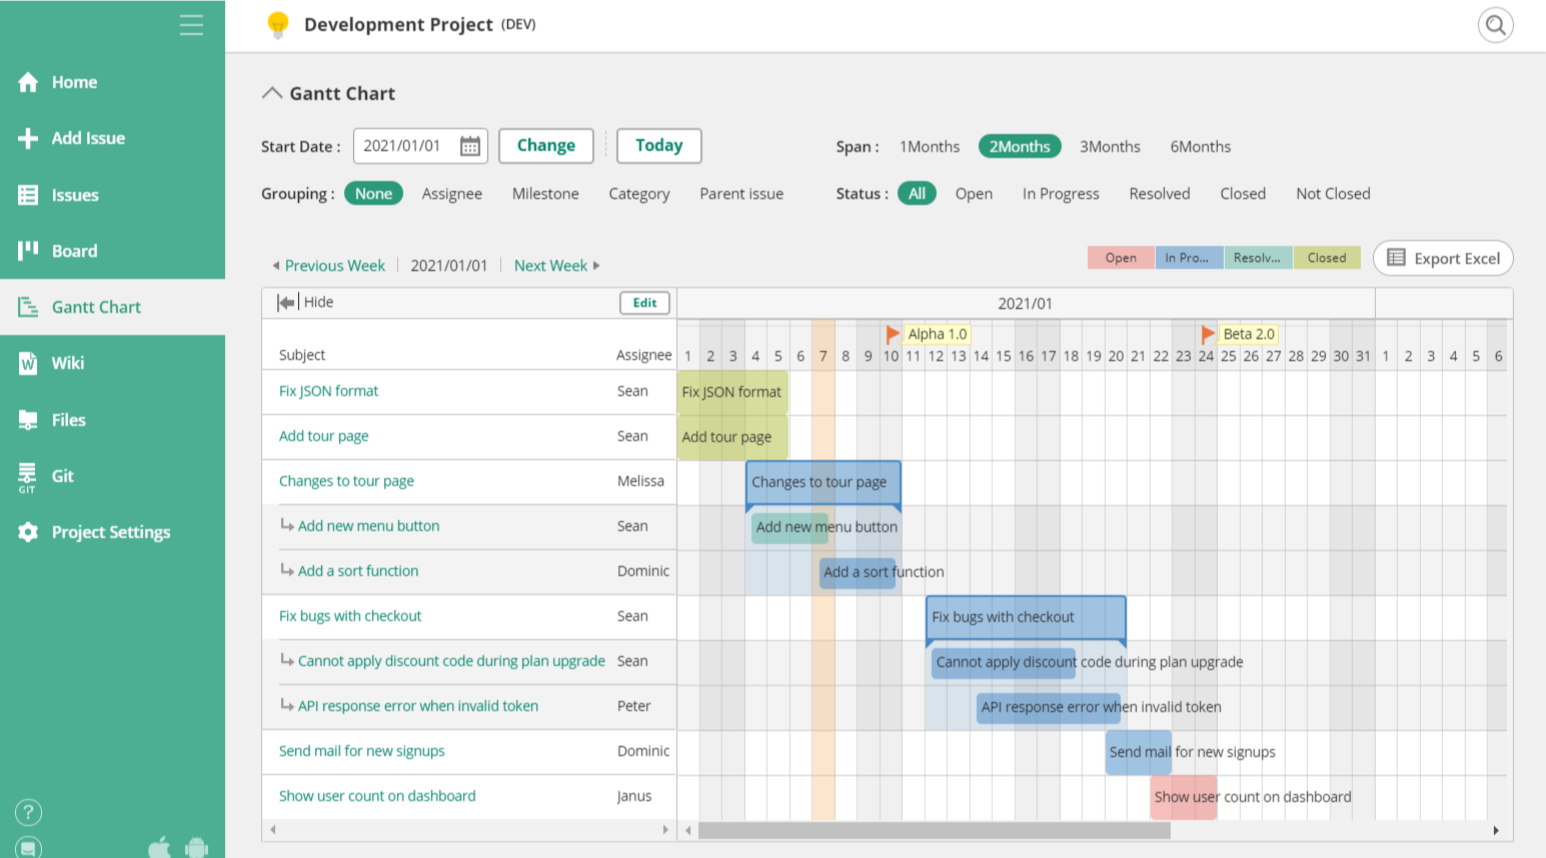
Below, you’ll see a Gantt chart from Backlog documenting a tech team’s progress toward migrating their existing website to a new platform. Each team member has clearly assigned tasks and a deadline by which these should be completed. It’s easy for the team members and the project planner to glance at this chart to understand their progress quickly.
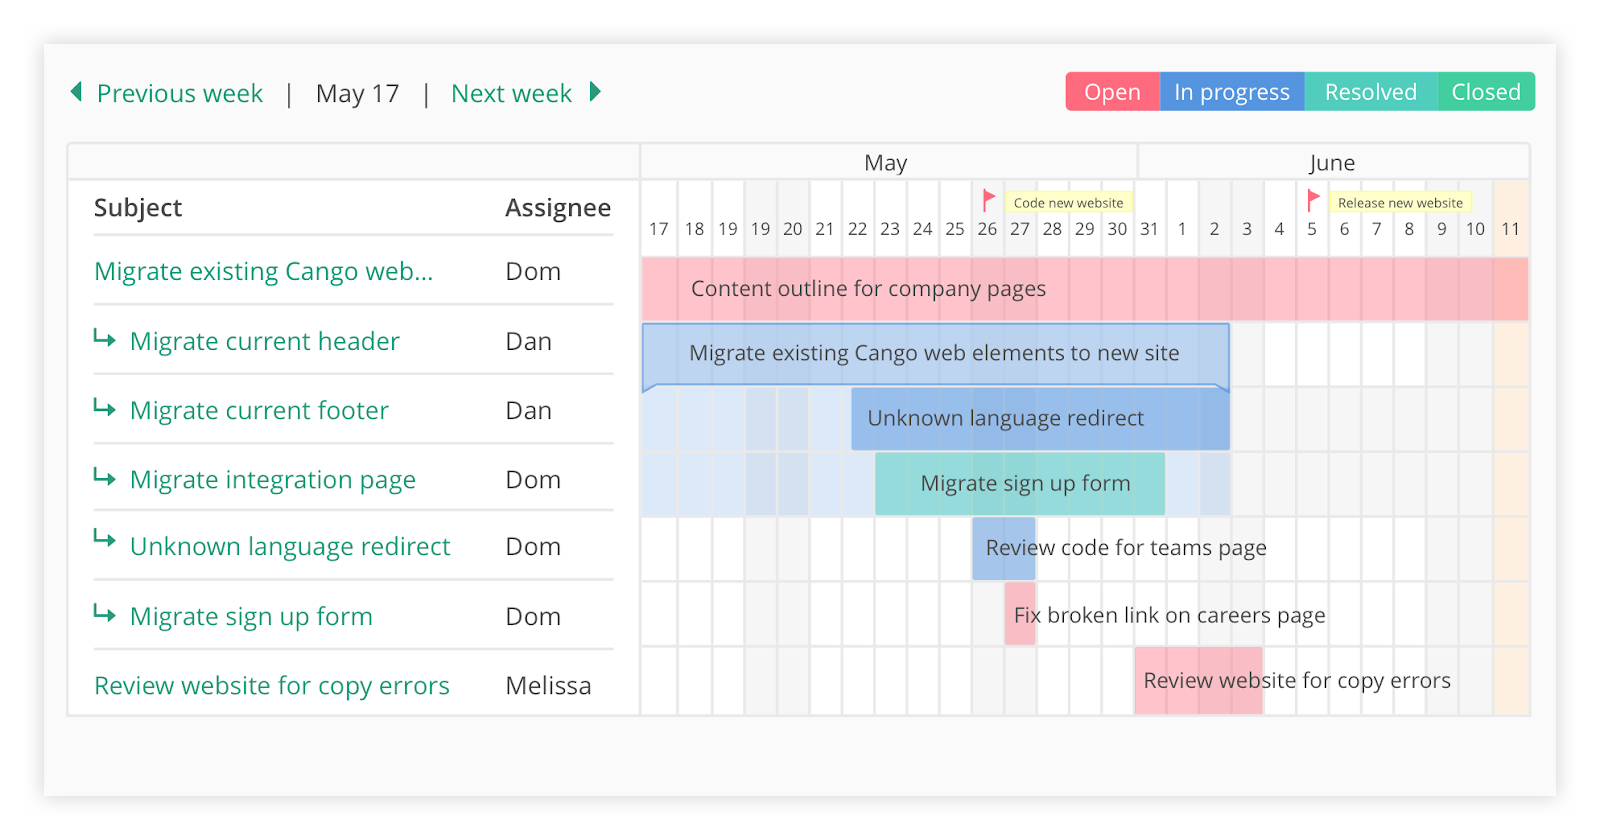
Gantt charts keep teams accountable for completing their tasks on schedule. Team members can view task dependencies, understand who they need to collaborate with, and quickly identify any bottlenecks in the project. This adds up to increased clarity and productivity, making for much more successful projects.
Backlog: the ultimate Gantt chart project planning software
Gantt charts are clearly an extremely useful tool in project planning. The traditional approach to using a Gantt chart has been to manually create one in a spreadsheet, but there are several issues with that approach. The information in these charts is often relatively basic and charts don’t update as tasks are completed. This might work at the very outset of a project, but as soon as work starts, the project plan is already outdated.
A better solution lies in using a project planning software tool like Backlog. Backlog allows teams to automatically generate Gantt charts based on their existing tasks and projects, helping teams stay ahead of the curve and prioritize important work. It’s a powerful project planning hub that helps teams and individuals better plan their work, identify potential issues, and visualize their project’s progress.
How to create Gantt charts with Backlog
Creating Gantt charts in Backlog is straightforward. You can get started right now by signing up for a free trial or by creating a paid Backlog account and following along as we walk through a step-by-step explanation of creating a Gantt chart in Backlog.
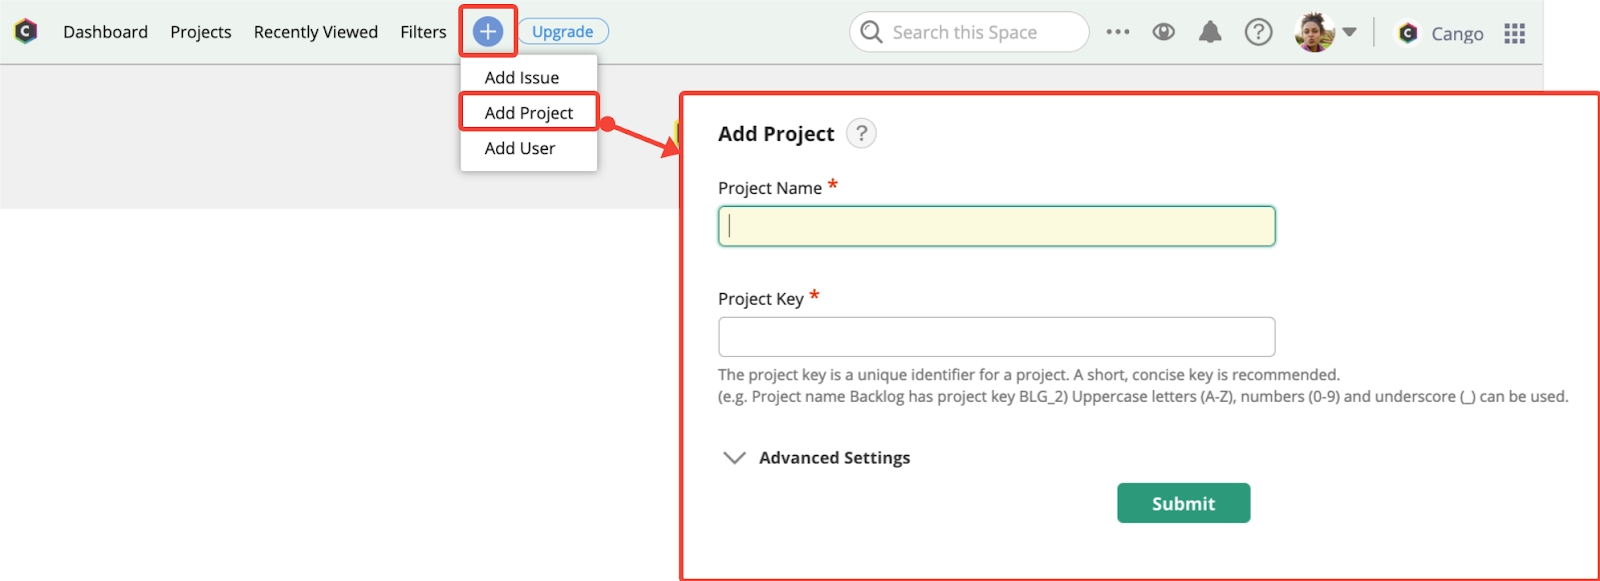
Once you’ve set up your free account, your first step is to create a project. In Backlog, a project is the wider work group under a series of tasks live. Example projects might include a website redesign or the launch of a new feature.
To create a new project, select the + button and click Add Project.
To be accomplished successfully, most projects have a sequence of smaller tasks that must be completed. For example, if your team was tasked with redesigning your business’s website, tasks might include copywriting, graphic design, coding, quality assurance, and so on. Each of these smaller components of a project is called an Issue in Backlog.
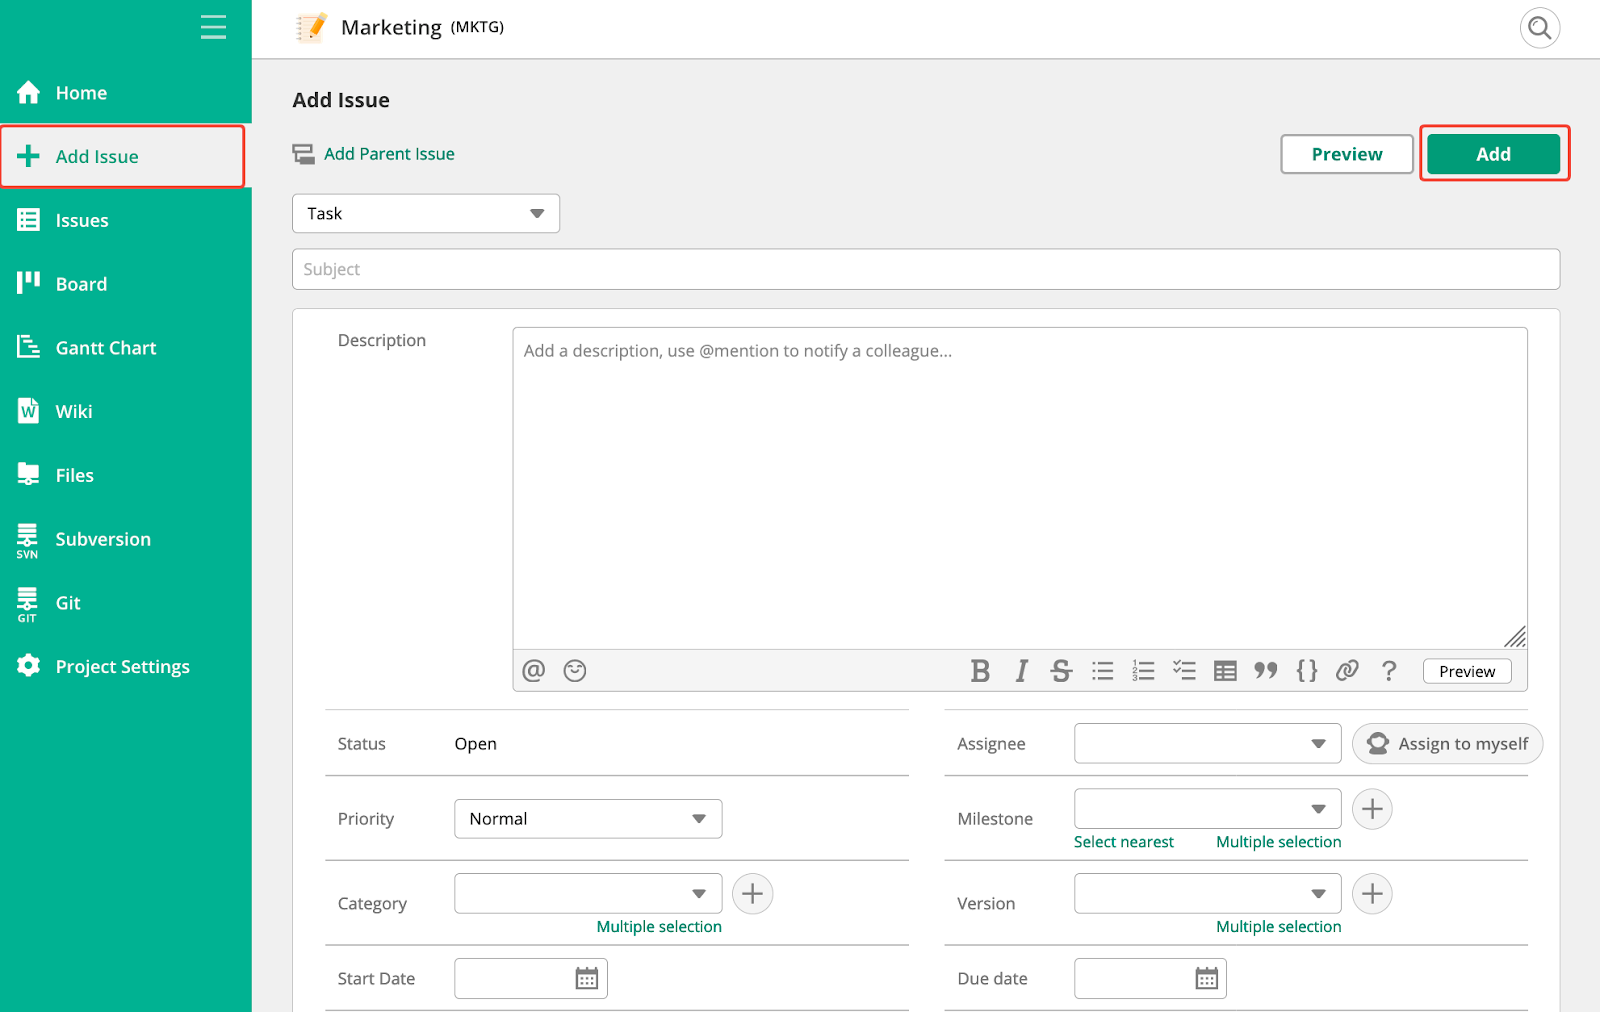
To create a new issue, select the Add Issue button on your Project Sidebar. Enter all of the relevant details your team members need to know: a description of the task, priority level, due date, the person responsible, and more.
Important: if you want these issues to display in a Gantt chart, you need to add a start date, due date, or milestone.
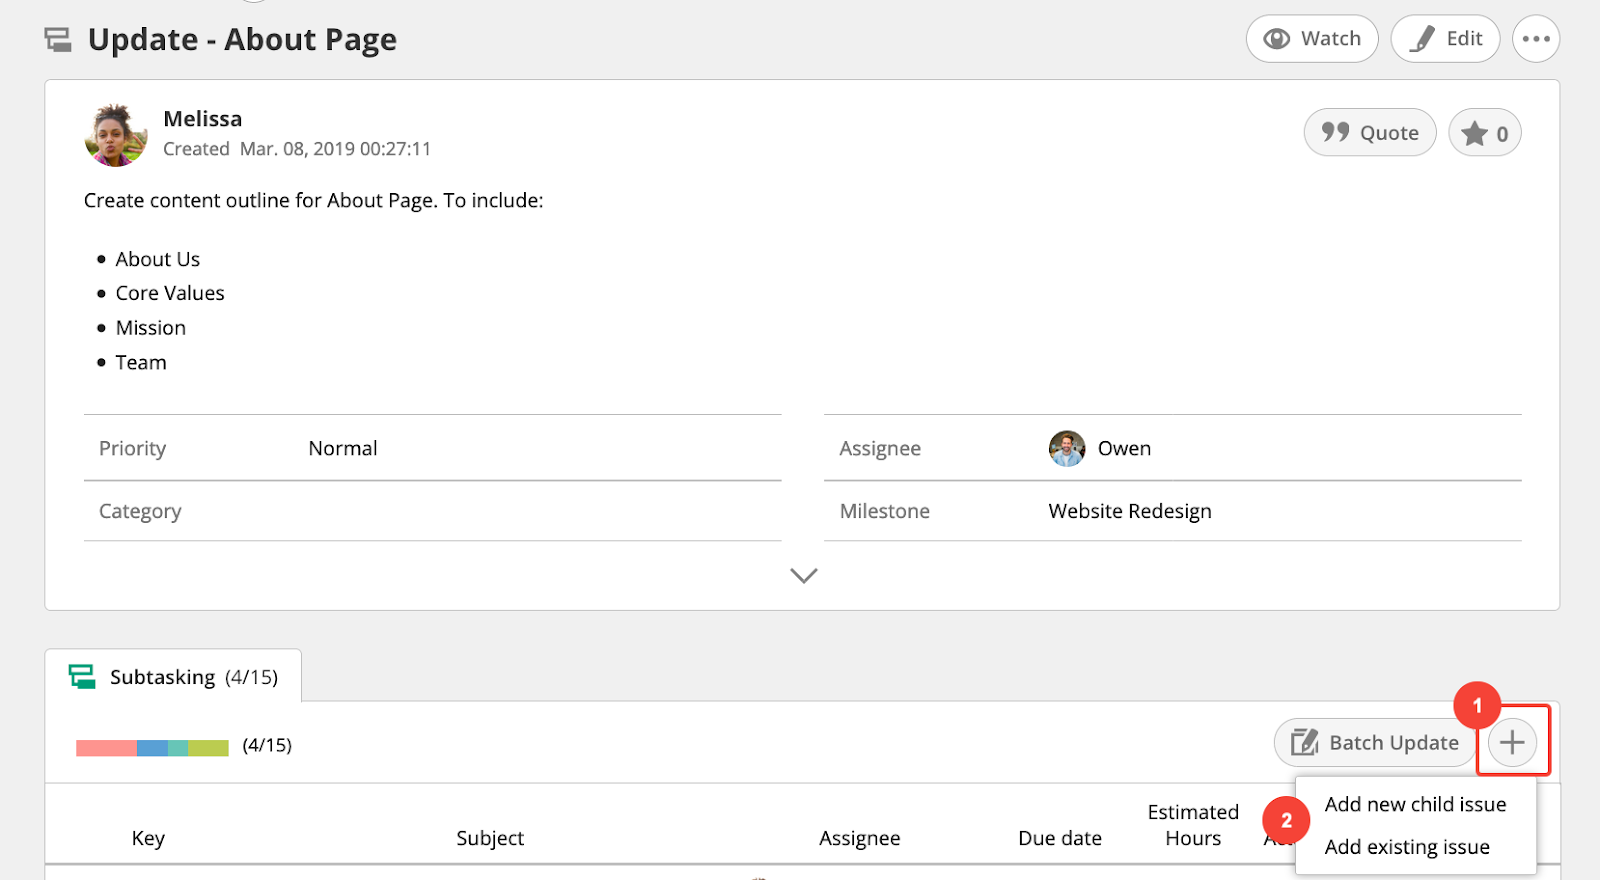
For more complex tasks, Backlog allows you to create Sub-Issues. Just select the + icon, then click Add New Child Issue. This feature is particularly useful for tasks with multiple stages. For example, in the website redesign project, the copy for the website will have to be written, reviewed, and edited before the project can progress – three separate sub-tasks.
Once you’ve set up a project complete with tasks and optional sub-tasks, it’s time to create a Gantt chart that outlines the project plan. To get started, click the Project Settings tab, then General, and select Enable charts.
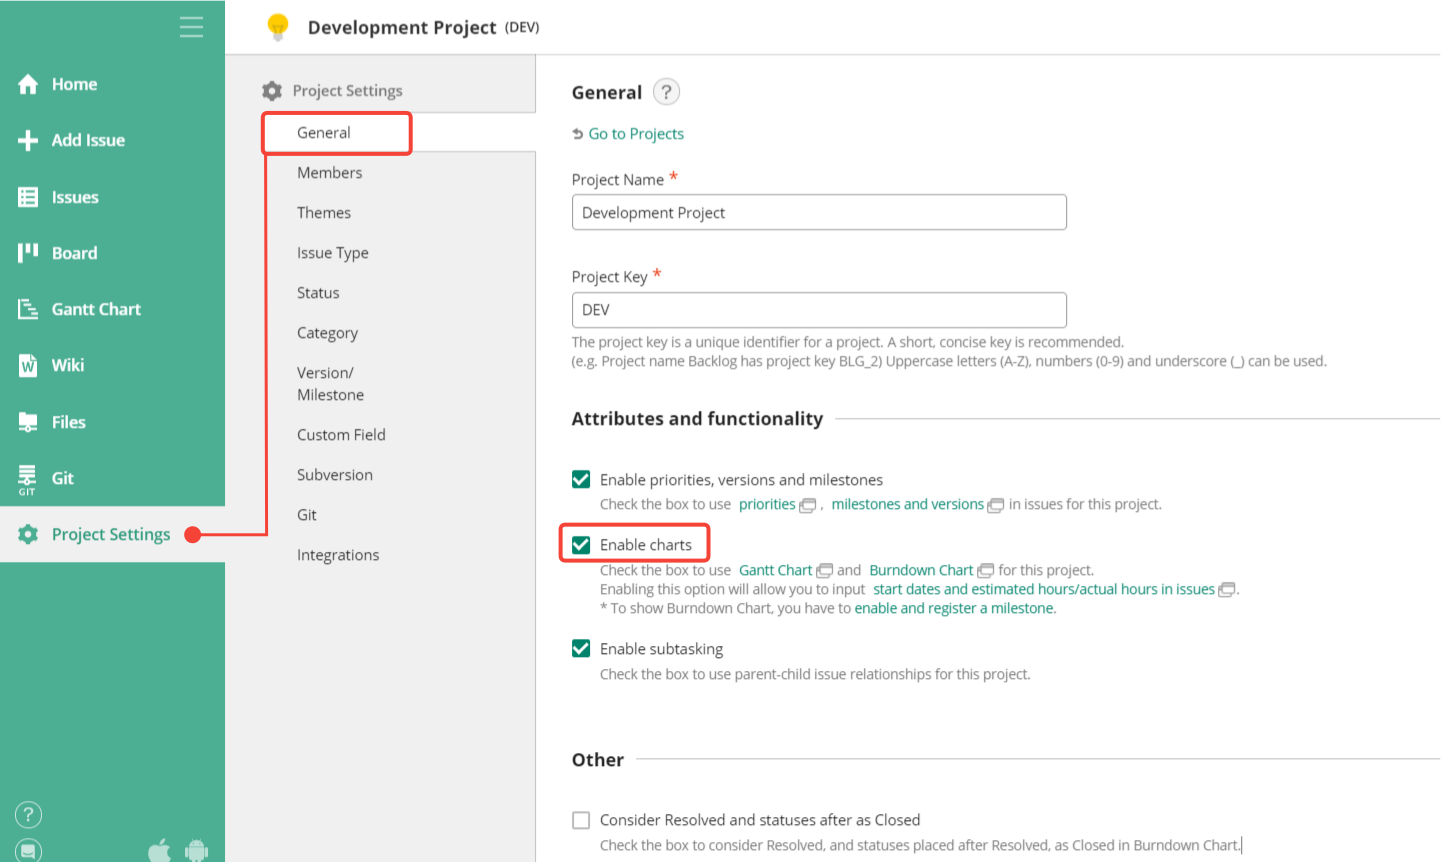
Click Confirm to save your settings, and presto! Your Gantt chart will automatically be created. Click on the Gantt Chart tab to view it. You’ll see the person assigned to each task, the start and due dates, the current status of the task, and more.
You can edit tasks in your project directly from the project Gantt chart in three ways:
- Change assignees and issue start/due dates
- Drag and drop issues to adjust timelines
- View and edit issues
Backlog also has a variety of features that enable users to customize their Gantt charts. For instance, users can filter their Gantt chart view to view issues with the status Closed to view completed tasks or In Progress to view tasks that team members are actively working on.
Project planners can also zoom in or out to look at a shorter or longer project timeline and add color coding for different categories of issues to make the Gantt chart easier to understand.
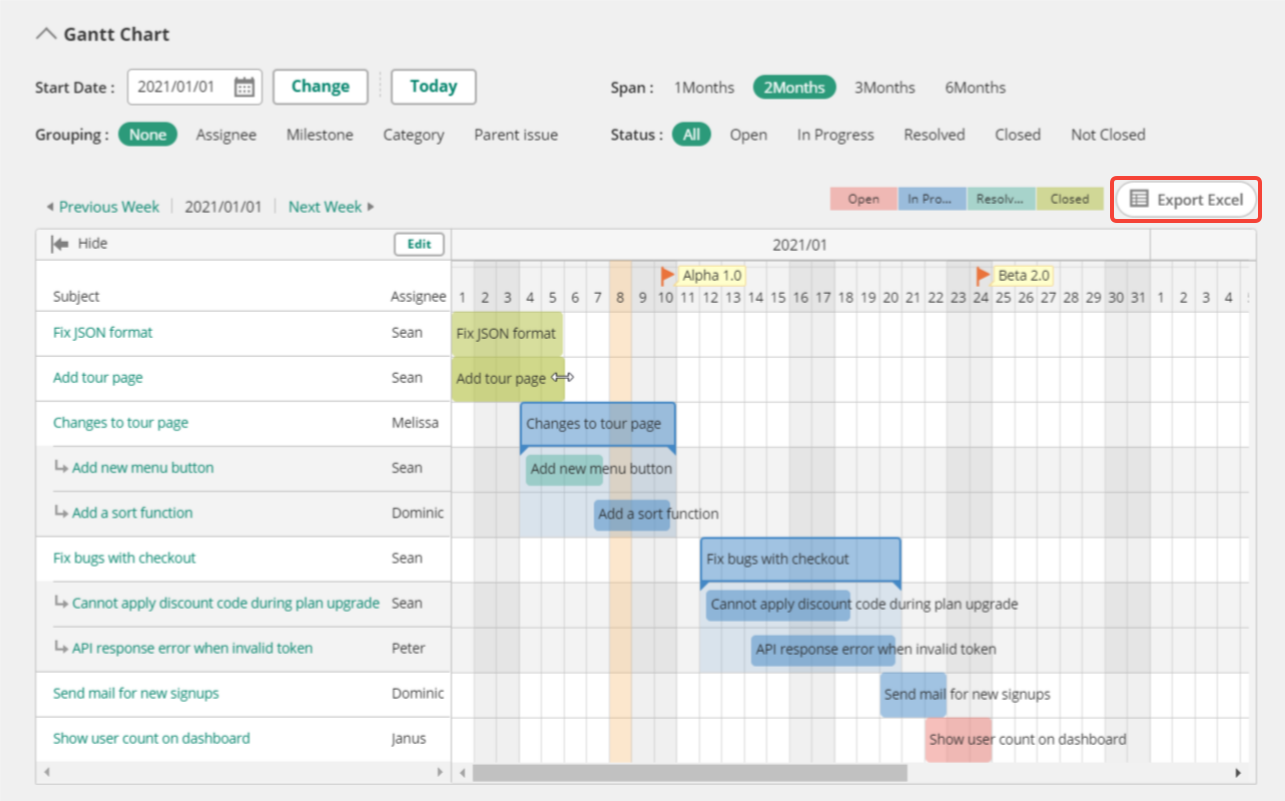
You might need to export your Gantt charts from Backlog from time to time. Just select Export Excel on the Gantt chart you’d like to export, and the chart will be automatically downloaded as an Excel file.
From there, it’s easy to share this visual display of project progress with anyone – even those not in Backlog. If you’d prefer, you can also share live Gantt charts by email, hyperlink, or by embedding these charts in another web property.
How to manage dependencies with Backlog
Dependencies are one of the core components of effective project planning. In a complex project, tasks must be completed in a certain order. The sequential relationship between these tasks is known as a dependency: one task cannot be started until another related task is completed.
For instance, a development team cannot complete quality assurance on a new feature that hasn’t been developed yet. The quality assurance task is dependent on the development tasks being completed.
Mapping these dependencies in a project plan can be challenging, but Backlog makes this process much more manageable. Just navigate to the task details panel in each issue to create dependencies between tasks that make it easy for your team to understand workflows.
In every project, some tasks are more important than others. By using the critical path method, project planners can identify these tasks. A critical path is the longest stretch of tasks dependent on each other and highlights the tasks that must be completed for the project to be completed.
Using the critical path method can help avoid dependency conflict issues that delay a project, but there are other methods that project planners can use too. Using a platform like Backlog, project planners can clearly assign responsibilities and create a simple, visual schedule that ensures everyone understands which tasks must be completed and by when.
How to collaborate on Gantt charts with Backlog
Gantt charts aren’t just a project planning mechanism; they’re a collaboration tool that enables teams to work better together on complex projects. That’s why Backlog makes it easy to invite team members and even external stakeholders to view or edit Gantt charts.
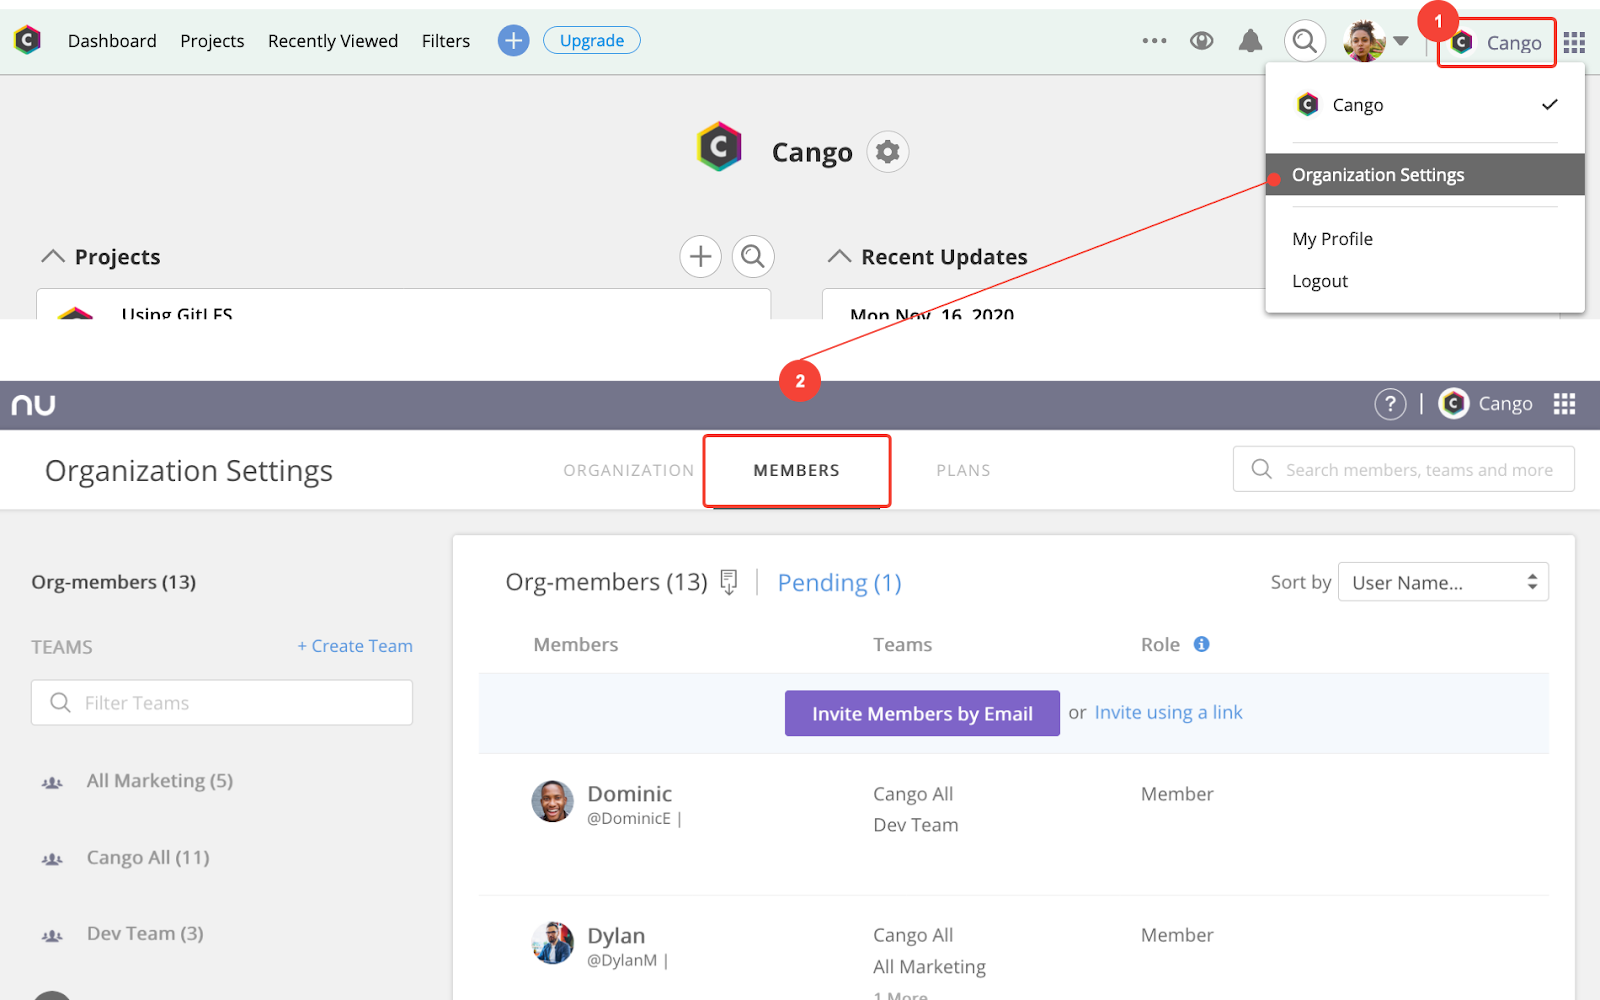
To add new users, navigate to the Organization Settings section, then select the Members tab. New users can be added as an Admin, Member, or Guest, and you can specify the level of access you would like each user to have.
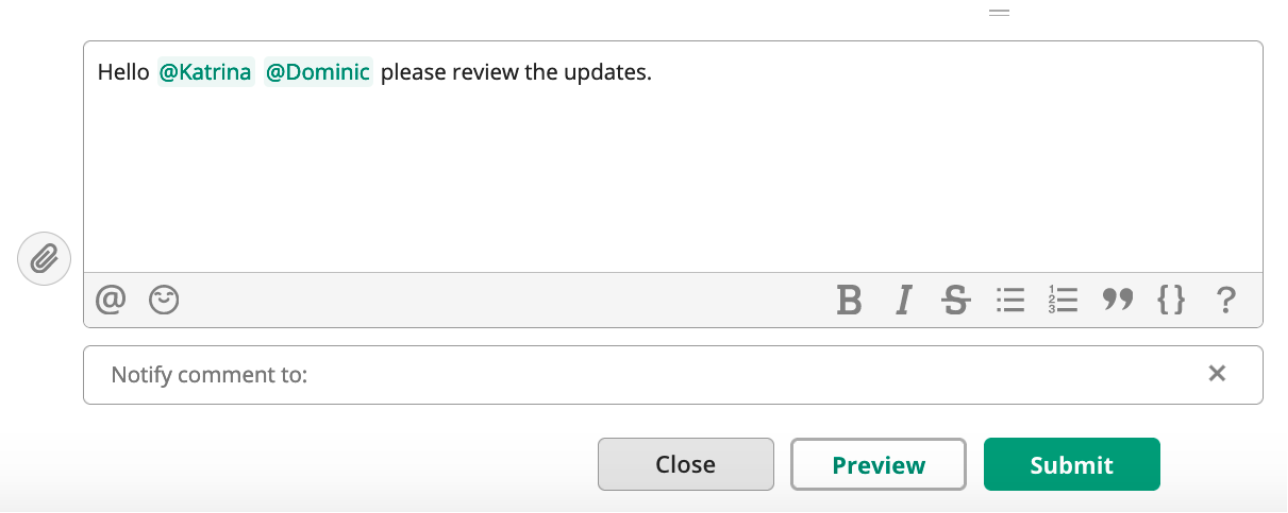
Within projects and Gantt charts, collaboration is seamless. Users can comment on individual tasks, mention other team members, or send notifications about tasks and sub-tasks.
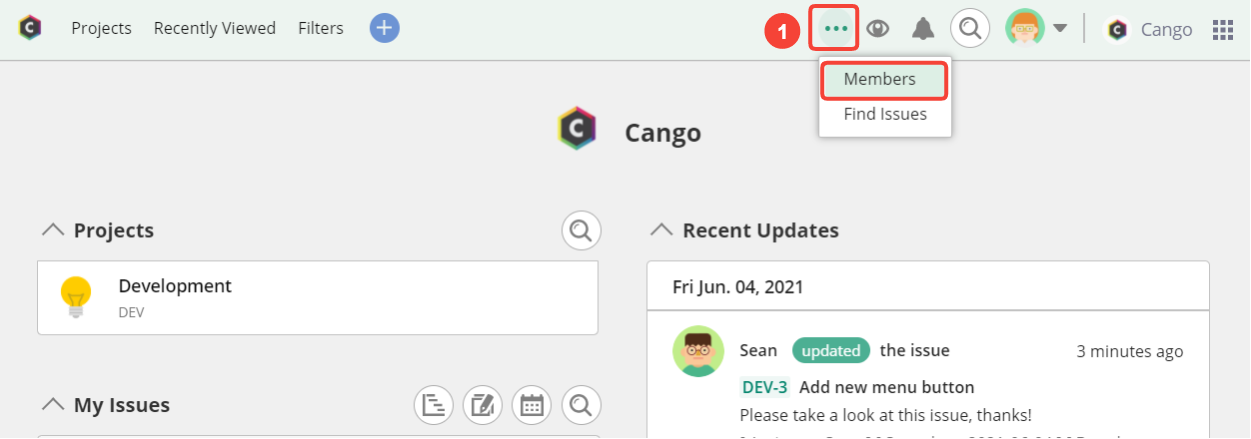
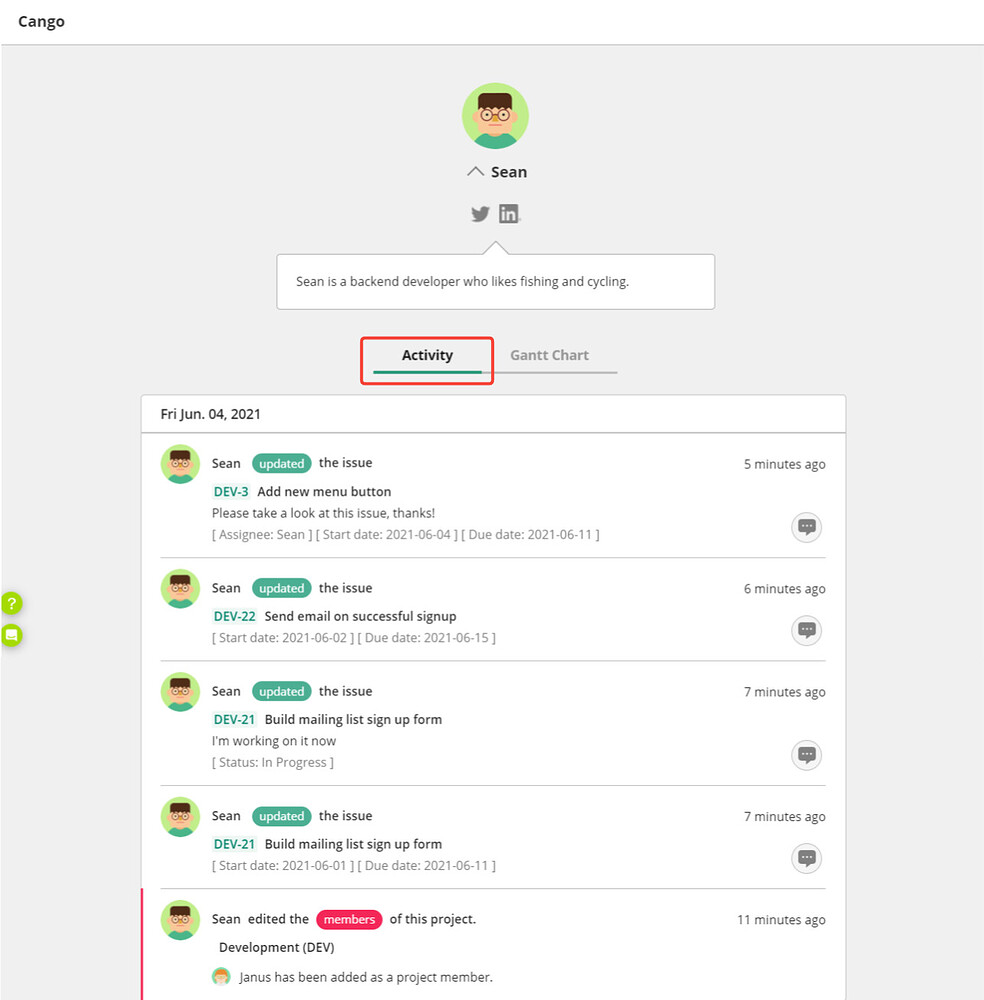
Project planners can track changes and updates by monitoring the activity logs of team members. To view an activity log, navigate to the Members tab, then click on the team member whose activity you’d like to view.

From here, you’ll see a breakdown of that team member’s activity, including comments, status changes, notifications, and more.
As a project progresses, project planners will frequently compare the actual progress of their project against the project plan. In Backlog, project planners can use a Burndown Chart to track this progress. These charts represent how a project progresses compared to its planned timeline, showing whether teams are ahead or behind their schedule.
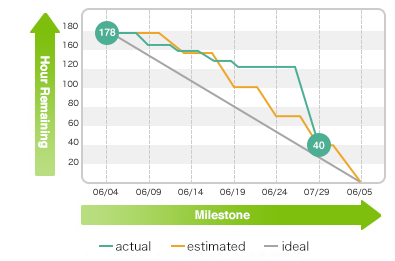
This example burndown chart shows a project that got a little behind schedule but is now caught back up.
The orange line shows the planned pace of work for the project, estimating how much work should have been completed, and by when, for the project to be progressing according to schedule.
The green line is auto-generated from a team’s Backlog activity and shows how the work has actually progressed. As you can see, this project got stuck for a little while and fell behind schedule, but the team was able to work together to get back on track.
These charts, combined with Gantt charts, offer project planners a simple, visual tool to report on the progress of their projects.
Start building Gantt charts today in Backlog
Incorporating Gantt charts into the project planning process is a tried-and-tested way to streamline project management and ensure higher levels of collaboration. But without the right Gantt chart software, it’s easy for these charts to become outdated and unhelpful.
With Backlog, project planners and their teams can automatically create Gantt charts that update in real time for every project they work on. With a simple, intuitive interface and powerful customization features, Backlog’s Gantt charts are the perfect solution for project planners in tech companies. Try Backlog’s Gantt chart software for free today.
About Author

Backlog Staff
Guest authorBacklog is the all-in-one project management software by Nulab. Combining task management, version control, and bug tracking, Backlog delivers the features teams need to create great projects in one simple tool.


