
Imagine trying to paint a sunset. Even with super speedy Bob Ross skills, you’d struggle to capture it exactly because the scene changes minute by minute.
Software development is a similar story. You might be working on one app or website, but as new features come in and customer requirements change, dev teams often find themselves working on a shifting product. It’s a challenge, even for those immersed in it every day.
This is where software architecture diagrams can be a big help.
A picture is worth a thousand words, or so the saying goes — and this really is true of architecture diagrams. They give the whole team, from developers through to IT operations, an easily digestible visual overview. It’s because of this that it’s easier for everyone to take in progress, concepts, goals, and ideas. In addition, in a fast-paced environment, keeping everyone on the same page could be the difference between success and failure.
Let’s take a closer look at the benefits and the uses of architecture diagrams. Afterward, we’ll run through some examples with tips on how to create your own.
What is an architecture diagram?
An architecture diagram is a visual representation of all the elements that make up part, or all, of a system. Above all, it helps the engineers, designers, stakeholders — and anyone else involved in the project — understand a system or app’s layout.
Think of it as being a bit like a blueprint to a building: You can see the thing as a whole, as well as different kinds of interior views, and things like pipes, walls, floorplans, and so on.

Architectural diagrams do the same: They show the whole system, as well as its various components.
The benefits of using software architecture diagrams
Diagrams make it easier to take in information. They also help with comprehension and recall. Here are some more benefits:
- Aid understanding: Diagrams offer a top-down view of a process or system, which makes it easier to get the gist of something at a glance. It also shows how each component interacts both with other components and as part of a bigger system — something that makes it easier for teams to collaborate more effectively. It also makes it easier for teams to see how the introduction of new features or jobs will affect other elements of the system.
- Improve collaboration: Being able to understand how processes and features interact means it’s easier to spot weak points, bottlenecks, or other issues. Plus, when everyone is working together efficiently, collaboration becomes a joint effort.
- Boost transparency: When you’re working on a non-static product, good communication is the difference between sinking or swimming. When the team — stakeholders included — are all working from the same diagram, it’s easier to keep track of jobs and progress. Architecture diagrams can also be helpful to use in meetings, presentations, whitepapers, and other technical documents.
5 different types
Here are some of the more commonly used software architecture diagrams you’re likely to encounter.
Application architecture diagram
This diagram gives a top-level view of a software’s structure. To elaborate, it generally includes various components that interact with each other and how the software interacts with external databases and servers.
It’s useful for explaining software to clients and stakeholders; and assessing the impact of adding new features or upgrading, replacing, or merging existing applications.
Integration architecture diagram
Integration architecture diagrams focus on how the components that make up a system interact with each other. Firstly, it shows the protocols for integrations, giving you a better idea of how they’ll affect the system as a whole and whether they’re in line with your team’s goals.
Secondly, it can also help you see how external systems will interact with the system — things like order fulfillment, eCommerce systems, and partner systems.
Deployment architecture diagram
These diagrams visualize network boundaries, along with the software, nodes, and processors that make up the system. They can also help you understand how different components communicate with each other. Not only that, but they also give you an overview of the physical hardware in the system.
Use a deployment architecture diagram to help plan strategic applications and service upgrades so your servers can handle more requests as the business grows.
DevOps architecture diagram
A DevOps architecture diagram visualizes the flow of app deployments. This makes it easy to spot deployments across internal and external systems. It’s also useful for spotting areas for improvement in processes and workflows.
- Check out our in-depth guide to DevOps to find out more
Website architecture diagram
A website architecture diagram is a key part of website design. It takes into account design, UX, and other practical elements. Hierarchical in nature, these diagrams show the layout of a website, breaking it down into different functions and content.
AWS architecture diagram
Amazon Web Services (AWS) is a cloud platform that provides database storage, content delivery, computes power, and other services.
An AWS diagram is used to describe the topology and design of apps built via AWS cloud solutions.
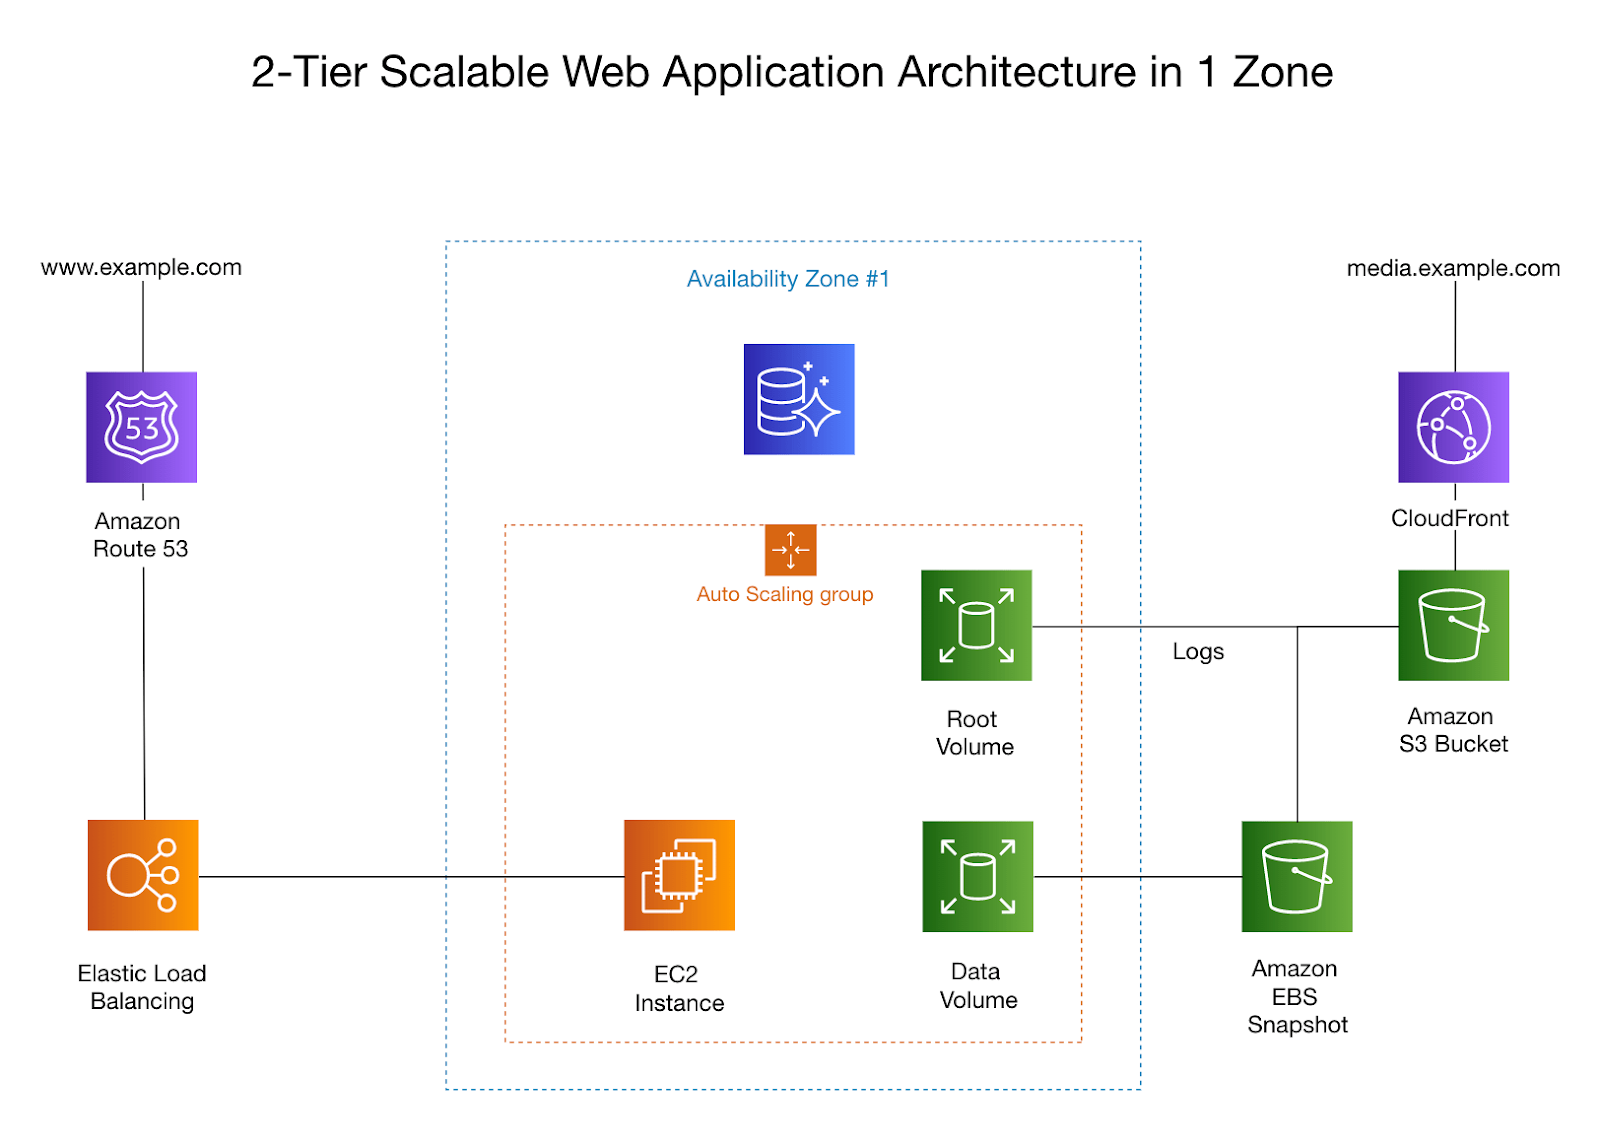
This diagram is an example of a 2-tier scalable web application architecture diagram in 1 zone.
- Create your own with Cacoo’s AWS architecture diagram template
Azure architecture diagram
Microsoft Azure (aka ‘Azure’) is a cloud computing service created by Microsoft. It’s used for the building, testing, deploying, and managing apps and other services through Microsoft-managed data centers.
Azure architecture diagrams help you design and implement app solutions on Azure.
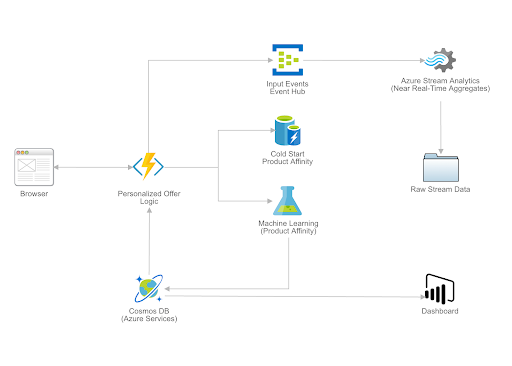
This Azure architecture diagram is an example of an Azure architecture diagram for personalized marketing solutions.
- Get started in seconds with an Azure architecture diagram template
Kubernetes architecture diagram
Kubernetes, or K8s for short, is an open-source container-orchestration tool designed by Google. It’s used for bundling and managing clusters of containerized applications.
Kubernetes architecture diagrams visualize the automation plan for deploying, scaling, and managing containerized applications. Simply put, is makes it easier for teams to understand the process.
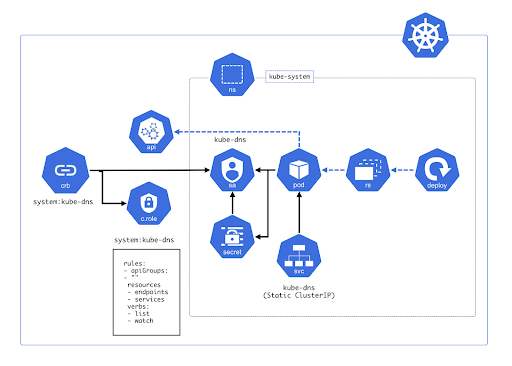
A Kubernetes architecture diagram visualizes the automation plan for deploying, scaling and managing containerized applications.
- Check out our Kubernetes architecture diagram template
GCP architecture diagram
Google Cloud Platform (GCP) is Google’s public cloud offering. Therefore, the difference between this and AWS and Azure is that GCP is built upon Google’s huge infrastructure that handles the traffic and workload of all Google users.
GCP architecture diagrams help you understand the design and operation of your Google Cloud Platform architecture.
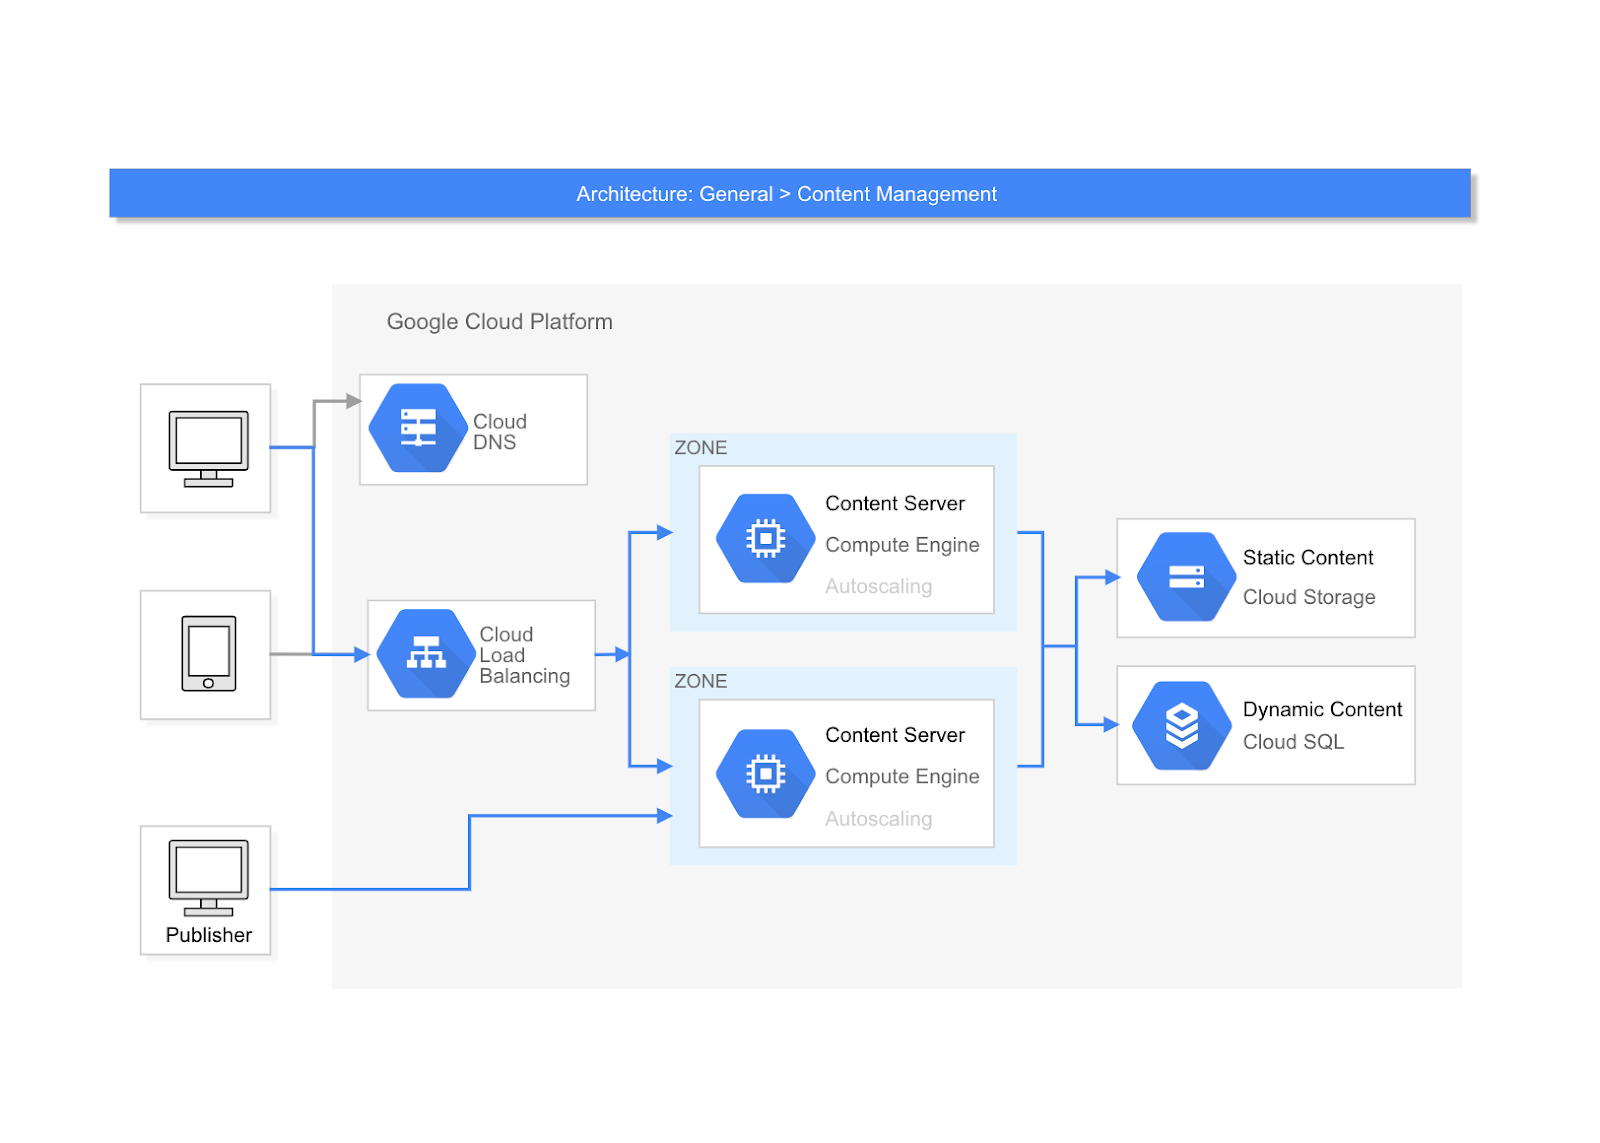
This GCP architecture diagram highlights the content management sourced from the Google Cloud Platform.
Producing and maintaining up-to-date GCP architecture diagrams allows you to easily understand the design and operation of your Google Cloud Platform architecture. It also gives you the ability to easily communicate your network topology design at all levels of your organization.
- Create your own with a GCP architecture diagram template
Best practices
Here are some tips and tricks for creating a top-notch architecture diagram.
- Don’t get hung up on detail: Diagrams are supposed to be overviews. They also need to be clear and easy to understand. Unfortunately, cramming as much detail in won’t do anyone any favors and negates the benefits of using a diagram.
Complex diagram = sad face (Image Source).
- Show system interactions: If you can use a shape or an arrow to say it, do it. Use lines to indicate process flows and interactions. This makes it easier to connect elements of the process and see how changes will affect the whole system.
- Use annotations (but not too many): Add notes to explain key parts of your diagram — but keep it short, and only use words when a part of the diagram can’t be understood without them.
- Make your diagram accessible: Share it widely. From attachments to emails and chats to a document stored on your wiki — the more places you can put it, the better. Better yet? Invest in a cloud-based diagramming tool, like Cacoo, and create it there. That way, everyone can access and work from it in real-time. In other words, no more hunting around for the right version or missing key updates.
Final thoughts
Software architecture diagrams are a helpful tool for visualizing highly complex processes in a way that’s easy to understand.
There are multiple ways to create your diagram, from sketches on a whiteboard to digital versions stored in the cloud. Because software development is a fast-moving environment, communication and collaboration are key. For this reason, we recommend investing in a good diagramming tool and using that to create your diagram.
With Cacoo, you can choose a template and edit simply by clicking and dropping shapes and icons into the positions you need. It’s also sharable, editable — and when changes are made, you can set up notifications, so everyone on the team is on the same page in real-time. Something that’s incredibly important when you’re working on something that changes minute by minute.
About Author

Georgina Guthrie
Guest authorGeorgina is a displaced Brit currently working in France as a freelance copywriter. Before moving to sunnier climates, she worked as a B2B agency writer in Bristol, England, which is also where she was born. In her spare time, she enjoys old films and cooking (badly).


