- All templates
- Research & Design
- HEART Framework
HEART Framework

Uses of the HEART Framework
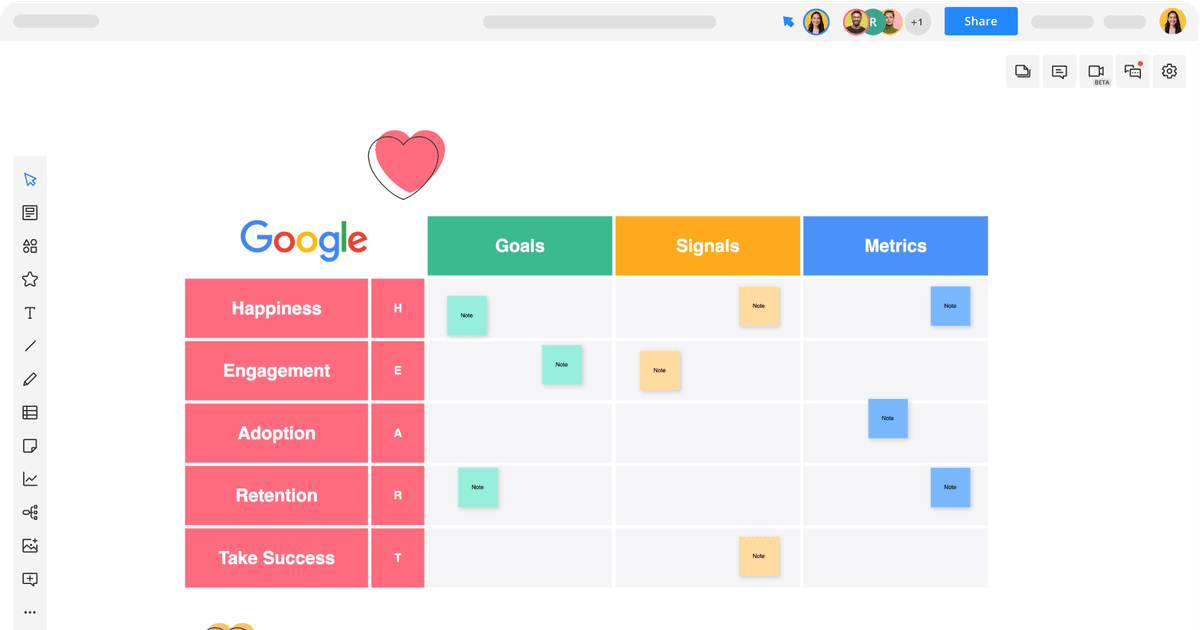
Google’s lead designer, Kerry Rodden, designed the Google HEART Framework to give design teams consistent metrics for evaluating the user experience. HEART stands for the five metrics: Happiness, Engagement, Adoption, Retention, and Task Success. Together, these performance metrics connect UX, product management, and business.
The Heart Framework aims to measure user experience on a large scale using automated means. And of course, there are countless reasons to evaluate UX performance on a routine basis, including:
- Driving product improvement and innovation
- Developing efficient marketing strategies
- Streamlining the user journey
- Increasing user engagement and retention
We all want to create better products for our users, and the HEART Framework helps designers and marketers do exactly that. The Cacoo template includes descriptions for each metric to help you follow the Google HEART methodology and assess product experiences from a user perspective.

How to create your own HEART Framework Diagram
Start with the first category (Happiness), and use the criteria to evaluate your product. Each criteria column represents the ideal conditions.
Consider whether the product is hitting the goals. For Happiness, a goal could be users enjoying the app.
Think about user behavior and whether their interactions signal an improvement or decline in product satisfaction.
Apply the suggested metrics in the last column to get transparent, trackable data that can be measured. For example, the Net Promoter Score or Number of 5-Star Ratings would be trackable metrics for happiness.
Repeat the process with the remaining categories: Engagement, Adoption, Retention, and Task Success.
Finally, use your findings to learn more, research potential problems, and develop user-oriented solutions. Share your Cacoo diagram with your teammates to collaborate on each step together.
Related tags
You may also like


