- All templates
- Planning & Management
- V Diagram
V Diagram
Plan and execute your next project by mapping out the steps needed to verify and validate the work.

Uses of V Diagrams
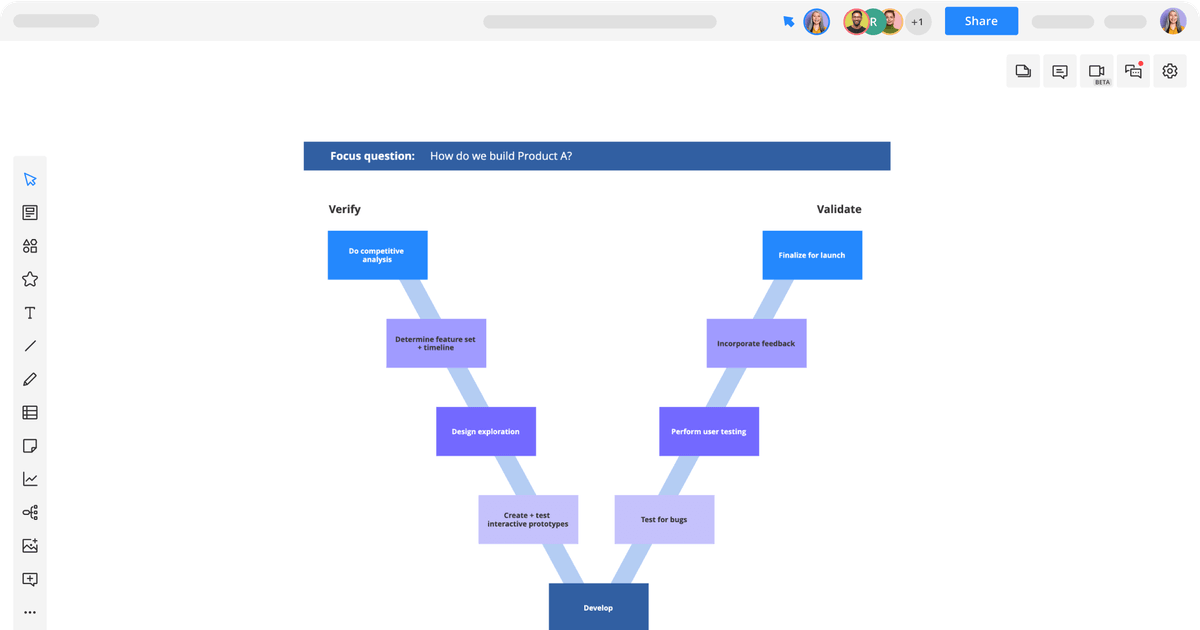
A V diagram is a visual tool for planning and executing a project (e.g., building a product, developing software). It helps minimize risk, create transparency, and ensure quality by mapping out the steps needed to verify and then validate the work.

How to create your V Diagram
1
Open the V diagram template in Cacoo.
2
Add your focus question, or problem you want to solve, to the top.
3
On the left side of the V, add the steps needed to get to the execution phase of the project.
4
At the base of the V, add your plan for executing the project.
5
On the right side of the V, note how you’ll validate the project including testing and data analysis.
6
Once your diagram is complete, look for any possible challenges or gaps in the process.
Related tags
You may also like
Research Plan Template

Research Plan Template
Bubble Map

Bubble Map
Impact Effort Matrix

Impact Effort Matrix