It’s just a fact of life that even the best-planned projects can go off the rails. Team members get sick, technology breaks, jobs cost more than you expected…
One of the biggest mistakes a project manager can make is to assume risks won’t happen. Not only does this leave everyone feeling a bit helpless — it could mean missed opportunities, or worse — the entire project grinds to a halt.
A risk breakdown structure is one way to identify potential issues and work out how likely they are to happen. Then, take steps to prevent them from happening or put a contingency plan in place to manage those you have no control over. Alongside a business impact analysis, It’s one of the most powerful techniques to know when it comes to mitigating risk — so it’s worth knowing how to do it.
In this article, we’ll dive into what a work breakdown structure is, then guide you through making your own template.
What is a risk?
Before we get into the ins and outs of a work breakdown structure, let’s define ‘risk.’ According to the Project Management Institute (PMI), a risk is “…an uncertain event that, if it occurred, has an effect on at least one project objective.”
Risks tend to be associated with negative events, like a part being missing or an employee quitting — but they can be associated with positive things too. Say, for example, you run an online clothing store. After an influencer shares a post of themselves in one of your creations, sales suddenly boom. If you’re not prepared, stock could run out, delaying orders, and the website crashes. Upset customers complain, and your brand gets a bad rep. This is an example of something good causing something bad.
Other risks have positive outcomes. For example, you might find an easier way to do something, or there may be a drop in the cost of raw materials. Being prepared for these means you’re well-positioned to take full advantage. Technically speaking, it’s an opportunity — but in the world of project management, it’s treated as a risk.
What is a risk breakdown structure?
A risk breakdown structure (RBS) is a chart that shows project risks in order of likelihood and severity. These risks are usually in seperate groups, depending on the type of risk they are. Here are some common categories:
- Schedule
- Financial
- Technical
- Management
- Client
- Contractual
- Weather
- Political
- Environmental
Organizing risks into categories makes it easier to cover every possibility. Once the primary categories have been defined, the project manager can then start thinking about sub-categories. The benefit here is that working through it logically makes it more likely you’ll consider every eventuality.
Why do a risk breakdown structure?
According to the PMI — ‘The aim of the WBS is to present project work in hierarchical, manageable and definable packages to provide a basis for project planning, communication, reporting, and accountability.’ It’s better than a list because it shows you grouped-together types of risk. It’s then presented as a hierarchy that makes it easier for project managers to see where they need to assign the most resources.
How do you score risks?
Every risk deserves attention, but some deserve more than others. Putting lots of time, effort, and resource into managing a risk that’s highly unlikely to happen draws your attention away from focusing on more probable scenarios. This is where scoring comes in: It shows project managers where they need to focus their attention most.
You’ll base your scoring on two factors: probability (P) and impact (I). How you define your risk/probability levels is up to you. Most people use between three and five for Probability and three for the Impact (which makes it handy for using a universally understood traffic light color scheme on your diagram).
Here’s an example of how you might break it down:
Probability
- High probability (80%—100%)
- Medium-high probability (60%—80%)
- Medium-low probability (30%—60%)
- Low probability (0%—30%)
Risk impact
- High: critical (rating A—red)
- Medium: moderate (rating B—orange)
- Low: minimal (rating C—green)
When it’s time to create your work breakdown structure, there are a few options available to you. You can grab a pen and hash it out on a whiteboard. Then there are spreadsheets, plus online templates and diagrams in your project management software.
Choose carefully: Whiteboards are fast, but they can be messy, and you can’t edit or share them easily. Spreadsheets are fine, but they’re list-like and not as easy to understand.
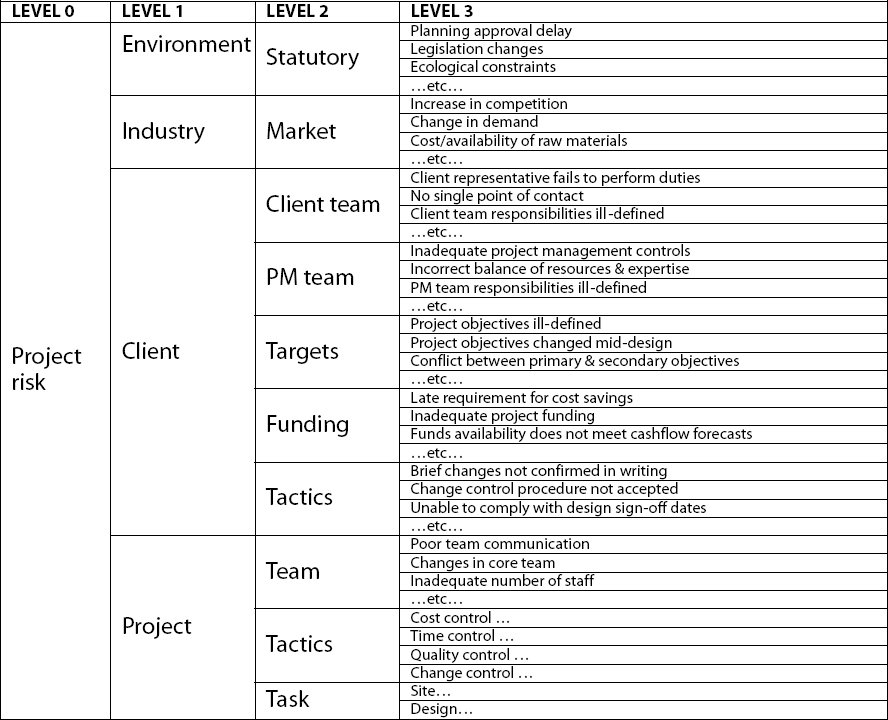
An example of a construction risk breakdown structure created in a spreadsheet (Image source)
As you can see, the more detail included, the less clear it becomes. In the interest of an easy life, we recommend using a cloud-based template — whether that’s created via a diagramming tool, or it’s a ready-made chart on your project management software. Having a pre-made template means you can start right away, while storing things on the cloud means everyone can access it — from remote employees to stakeholders.
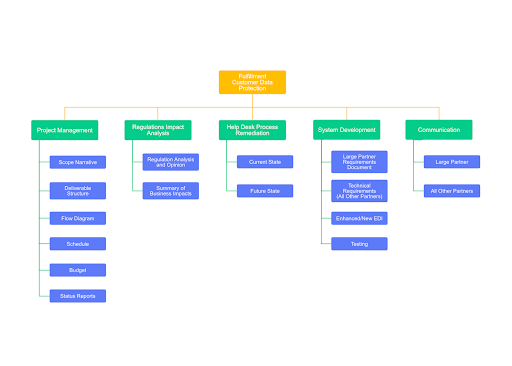
A breakdown structure created in Cacoo
Once you’ve found your template, start filling in the boxes at the top. Start with your major risk categories. Once they’re filled in, you can start to break them down into subcategories and start assigning values.
Top tip: One person can’t possibly know every single risk — which is why it’s important to make this a team effort. Share your diagram early with the team and for everyone’s input. The more viewpoints you have, the fewer risks you’ll overlook.
Final thoughts
Successful risk management depends on a clear understanding of the risks that face a project. Using a risk breakdown structure to logically work through each area can help you create an ordered, detailed view of every potential risk (and opportunity-risks). This makes it easier for you to plan and assign resources — so that if a risk occurs, the team is better able to handle it.
Using a cloud-based tool makes the process a lot easier. With Backlog, our own project management platform, managers can create their risk diagram using a pre-made template, then share it with the wider team. Teammates can then log in, understand the risks themselves, and add their own comments. This turns the risk management evaluation into a living, breathing, collaborative effort — and the diagram itself becomes a central part of the project (rather than something that accidentally gets wiped away or collects dust in a long-forgotten folder, never to be seen again).
About Author

Georgina Guthrie
Guest authorGeorgina is a displaced Brit currently working in France as a freelance copywriter. Before moving to sunnier climates, she worked as a B2B agency writer in Bristol, England, which is also where she was born. In her spare time, she enjoys old films and cooking (badly).


