From the smallest boutique to the biggest corporation, every business requires processes to run. When you manage processes effectively, work tends to run smoothly. But when you don’t, unexpected errors arise, productivity slips, and budgets become difficult to estimate properly. Understanding each series of steps and interactions that form the organization’s operations is crucial for efficiency, and process mapping can take that efficiency to new heights.
What is process mapping?
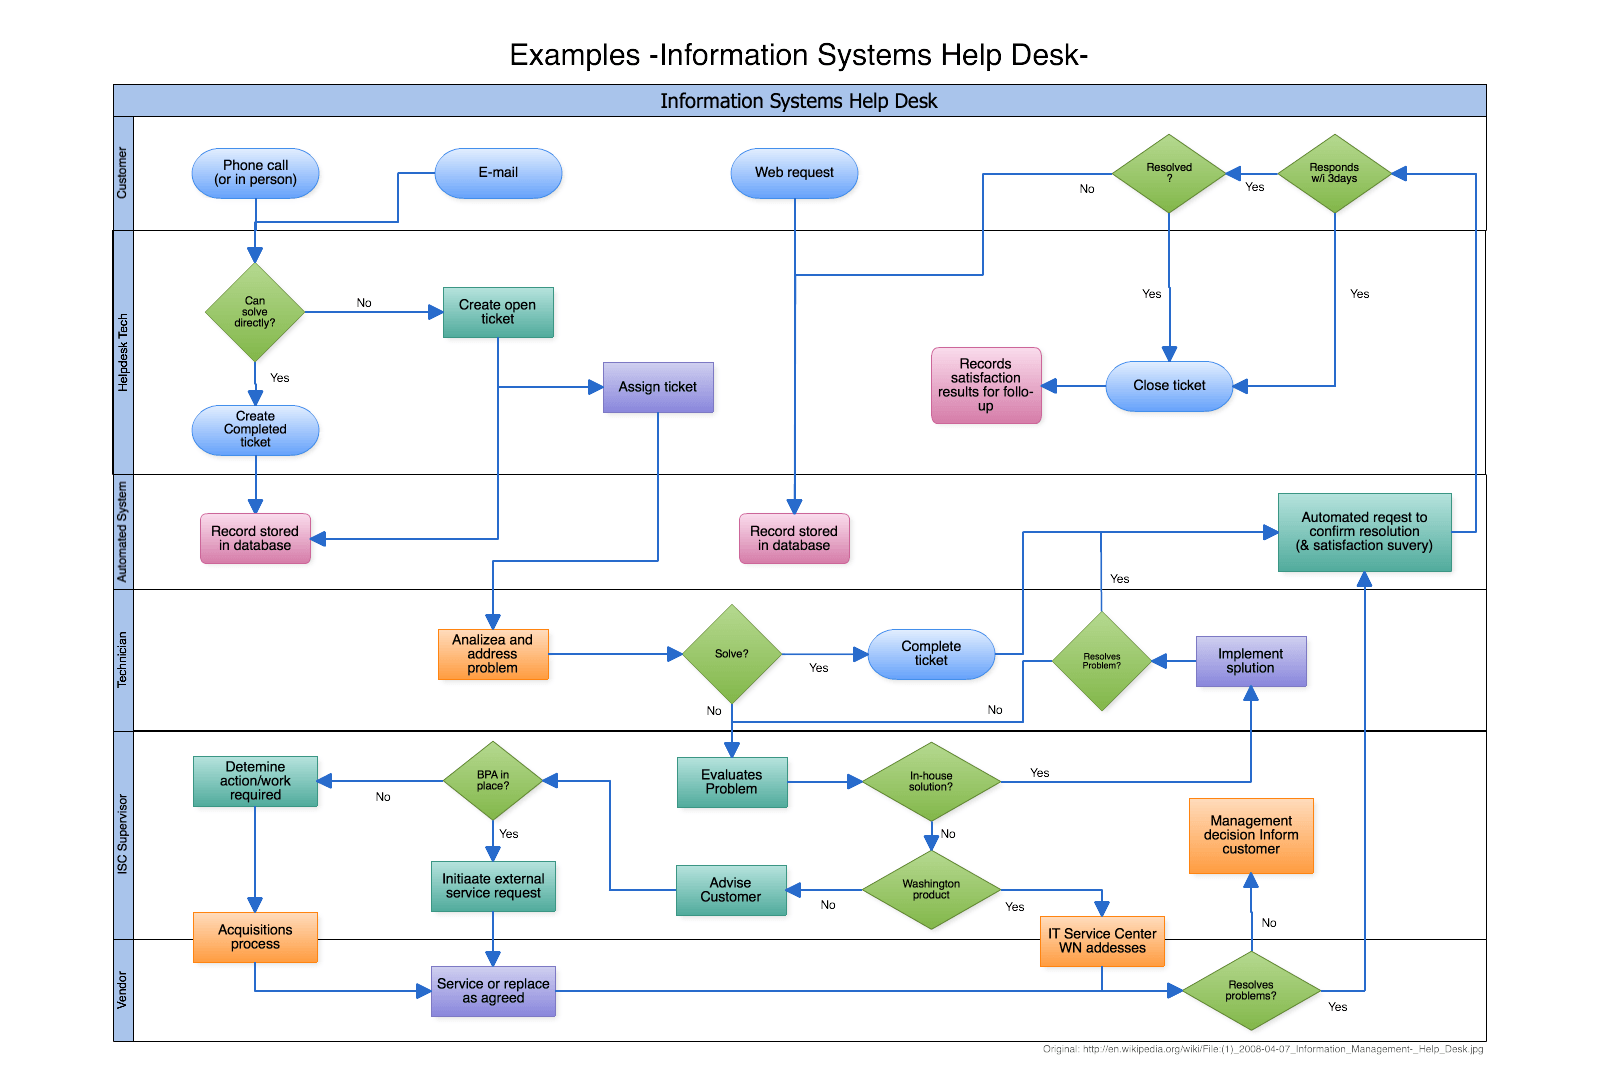
Process mapping gives you a high-level overview of every step and decision involved in a process and how each stage relates. In short, creating a process flow map is a visual way to understand your business processes from start to finish. Workflow diagrams and flowcharts are common forms of processing mapping.
Why use a business process map?
The ultimate goal is to improve efficiency, identify bottlenecks or other potential issues, and define responsibilities. Process mapping helps you determine how to achieve a better workflow and clarifies the information by presenting it in a format that’s easy for everyone to understand.
Process maps are used to:
- Help people understand complex workflows.
- Show an entire process from start to finish.
- Refine and improve specific processes.
- Improve communication between individuals either engaged in the process or seeking to understand it.
- Provide documentation for reference and training purposes.
- Help with planning and decision-making.
- Conduct scenario testing and what-if assessments.
- Prove to stakeholders that your business processes are reliable.
- Act as a jumping-off point to more complex process diagrams, including data flow diagrams, flowcharts, and more.
- Comply with many types of standards and certifications, such as the ISO 9000.
Types of process maps
It’s a good idea to acquaint yourself with as many types of process maps as possible. There’s no one-size-fits-all solution, and you may need to switch between methods to suit your project goals. Here are the most popular process mapping examples you’ll encounter in the business world.
Activity Process Map
Activity process mapping represents value-added and non-value-added components in a process. This diagram is ideal for streamlining a workflow and managing budgets because it shows which activities directly impact revenue.
Detailed Process Map
In Six Sigma methodology, detailed process maps provide a more in-depth breakdown of the high-level process map. It includes more sub-processes with exact details about the inputs, outputs, and people involved in each step.
Swimlane (or Cross-functional) Map
Swimlane diagrams separate two or more workflows within the organization while retaining their sense of interconnectedness. They can be used to demonstrate how different roles contribute to a larger project or task.
SIPOC Map
A SIPOC map is a high-level representation of a process involving interactions between the Supplier, Input, Process, Output, and Customer (SIPOC). A form of swimlane diagram, SIPOC maps focus on analyzing the different aspects of workflow and distinguishing their levels of importance.
Value Stream Map
Value stream mapping is a Lean management technique that visualizes how you create value for customers. The goal is to analyze every task in your current workflow to identify processes that add or subtract value. Value stream analysis is useful for eliminating sources of waste, and its primary purpose is to drive future improvement.
Workflow Diagram
A workflow diagram is a high-level visualization of a business process as a whole. This method provides a step-by-step look at how crucial processes work, which can help to clarify roles, fix problems, or create consistency. Workflow mapping involves simple symbols representing a task and arrows demonstrating steps or relationships.
Rendered Process Map
Rendered process mapping represents the current state and/or future state of processes to help you locate areas for improvement. It’s a more detailed, pictorial version of a workflow diagram. Instead of only using shapes and arrows, rendered maps include graphical images to represent people, places, and resources.
Process mapping symbols: what they mean
Each process map consists of several key elements. Namely, you have your inputs, outputs, actions, activity steps, decision points, functions, people involved, process measurements, and time required. Each of these actions is represented by a symbol.
Having a universally recognized set of symbols means that anyone — technical or not — can make sense of your process map. The most important thing is to use these standardized symbols correctly and consistently. There are over 20 to choose from, but here are the most common types:
- Oval: This signifies the beginning and endpoints of a process. You’ll find ovals at the edges of your diagram.
- Rectangle: This is where you put instructions or actions.
- Diamonds: These signify decisions. Just like in a flowchart, diamonds contain a question. They lead to a yes or no answer, and you must make a choice to progress.
- Arrows: These connect the shapes. Follow the arrows to the next step.
- Circles: These are connectors linked via arrows. Circles indicate that the reader should leap from one section to another, bypassing other stages.
- Parallelogram: These show inputs or outputs.

Numbering conventions
One way to organize process mapping is to follow a numbering convention. This helps readers navigate your steps — something that’s especially important if you have a Detailed Process Map. Here’s an example format:
- Process 1
- Sub-process 1.1
- Sub-process 1.1.1
- Sub-process 1.1.2
- Sub-process 1.2
- Sub-process 1.2.1
- Sub-process 1.2.2
- Sub-process 1.1
- Process 2
- Sub-process 2.1
- Sub-process 2.1.1
- Sub-process 2.1.2
- And so on.
- Sub-process 2.1
What are the benefits of process mapping?
By now, you might be thinking, “I know my business processes really well. What my company is doing works, and we don’t need to change. Why should I spend time diagramming these complex processes?”
For one thing, you aren’t omniscient. You’re not involved in every single task or decision made in your organization. And when you perform a job often, it’s easy to ignore opportunities for improvement out of complacency.
Objective assessment
Business process mapping allows you to look at your workflows objectively and develop achievable goals. Waste, for example, is a deeply ingrained problem that’s difficult to spot until you assess where your processes are adding or losing value. You could be performing extra steps that don’t improve quality or profit or missing out on low-cost solutions to increase revenue.
Talent and resource management
Mapping out business activities allows you to see whether you’re allocating resources in the best possible ways. By evaluating what resources the business needs to function at optimal capacity, you can improve your project planning, supplier relationship management, and acquisition of new assets.
Mismanaged talent is another common issue in companies of all sizes. Many companies recruit new hires for specific skills but assign them roles that don’t utilize their value. Use process maps to determine whether staff roles are imbalanced or failing to create value the way you expected.
Scalability
Scalability should be top of mind for any growing business. You need to be able to maintain the same level of efficiency as you expand and workers come and go.
Business process maps serve as training resources for onboarding new hires. They also provide reference material for seasoned staff. If you make an effort to create these diagrams once, you’ll complete future process mapping tasks much faster.
How to create a process map
So, you’ve decided what type of diagram you’re going to create. You know your symbols like the back of your hand, and you understand numbering conventions. Now, it’s time to roll up your sleeves and get started on a real process map.
Step 1: Identify your goal
First, take some time to define your process or workflow. What is the key focus? Turn this into your diagram title, and add a date for reference.
Step 2: Define the activities involved
You don’t need to sequence everything at this point, but listing all the stages will help you remember everything that should go into your diagram. Assign a person to each stage and set a completion time. It’s okay if this changes later; just plot it out roughly for now. Let your time constraints and project needs determine how much detail you include at this stage.
Step 3: Sequence your process
Where or when does the process start? Where or when does it end? Add this information to your diagram. You should also sequence each step in between your start and end. You can either represent it as a basic flow or add layers of detail; it’s entirely up to you.
Top tip: Use a verb, such as ‘start’ or ‘meet,’ at the beginning of each description. This gives each stage an actionable purpose.
Step 4: Draw basic flowchart symbols
Use Unified Modeling Language (UML) and ensure that each element in your process map is represented by a specific symbol. You may also want to add a map key to your diagram so that anyone who refers to it can understand what the shapes mean.
Step 5: Review with others
Review the map with team members, supervisors, suppliers, customers, or any other relevant parties, and make sure everyone’s on board. Some key questions to ask include:
- Are there any steps missing?
- Is this the most efficient way to run the process?
- Are any steps redundant?
- Is everyone in agreement?
Step 6: Implement and monitor the changes
Focus on the small-scale improvements first and then apply changes on a larger scale. Remember to monitor your changes to see whether any stage needs further optimization.
Step 7: Choose your tools like a pro
You can create a process map on a wide range of software, but by far, the easiest option is with a dedicated online diagramming tool.
When you create diagrams in the cloud, your team always has the latest version at their fingertips. You can get feedback right on your diagrams with in-app comments and edit them simultaneously in real time.
Avoid teaching yourself the latest complicated design software, and stop sending out repetitive emails whenever you make an update. Quality process-mapping software will streamline your designs and your collaboration with others.
This post was originally published on June 7, 2019, and updated most recently on January 10, 2022.


