
Venn diagrams are popular diagrams that illustrate the similarities and differences between two distinct concepts. Invented by John Venn in the 1880s, they’ve long been a popular tool in many walks of life.
The beauty of Venn diagrams lies in their simplicity. Two or more circles, each representing a unique idea, dataset, or concept, are partially overlaid. The areas of overlap are the areas of commonality between two ideas, while the standalone portion of each circle represents the unique characteristics of each idea.
Venn diagrams started as a conceptual framework in the academic fields of mathematics, statistics, and linguistics. Still, today, they’re used in all kinds of settings, from the business world to schools and universities.
Here are some popular applications of Venn diagrams:
- Competitive analysis: highlight the similarities and differences between two competing products or services
- Audience segmentation: documenting shared characteristics of target audiences
- Org charts: highlighting different roles within a company and their relation with each other
- Teaching resources: help students compare and contrast different ideas.
The truth is that you can use Venn diagrams in an almost endless number of scenarios. By doing so, you’ll find that you’re better able to understand and explain complex ideas.
Cacoo: an intuitive digital Venn diagram maker
Effective Venn diagrams are visually appealing, well-organized, and easily shareable. Sure – you might be able to create a quick Venn diagram on a piece of scrap paper, but that’s hardly suitable for a professional or academic audience.
When that’s the case, you need a digital Venn diagram maker. Enter Cacoo, an easy-to-use online Venn diagram software. Cacoo makes it easy for teams to identify relationships between data sets, brainstorm new solutions, and discover ideas with shared common ground.
It’s an intuitive online diagramming software that’s easy for anyone to learn how to use. Teams use Cacoo to collaborate digitally in real time, exchange ideas and feedback, and share their work with a broader audience.
From our perspective, it’s the best and easiest way to create Venn diagrams online, and in this guide, we will walk you through everything you need to know to do that. We’ll share a simple five-step process to create a digital Venn diagram:
- Create a new project and choose a template
- Add shapes and text
- Arrange and group the shapes
- Add labels and legends
- Share and collaborate on the diagram
Why not sign up for a free Cacoo account and follow along with us? By the time you’re done reading, you’ll have your first Venn diagram completed – it’s that easy!

Step 1: Create a new project and choose a template
Cacoo allows you to either create a Venn diagram from scratch or get started using one of the platform’s built-in Venn diagram templates.
If it’s your first time using Cacoo, we suggest you start with a template: it’s the fastest, easiest way to begin creating effective Venn diagrams. Instead of spending your time formatting circles and connectors, you can move straight into brainstorming new ideas.
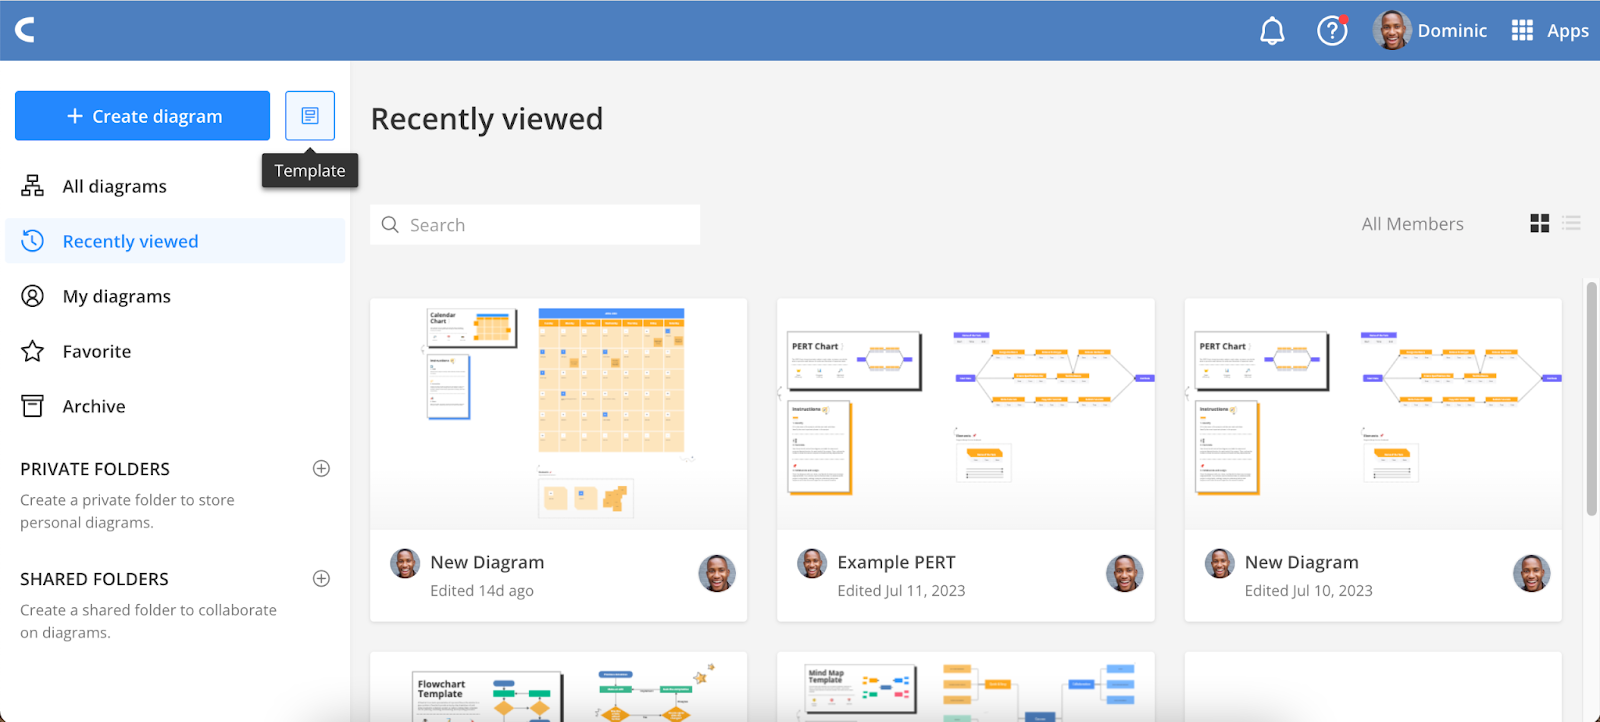
Cacoo comes with three Venn diagram templates, each with a different number of circles. You can view these templates in the Cacoo template library. To browse the template library, click the Template icon on your Cacoo dashboard.
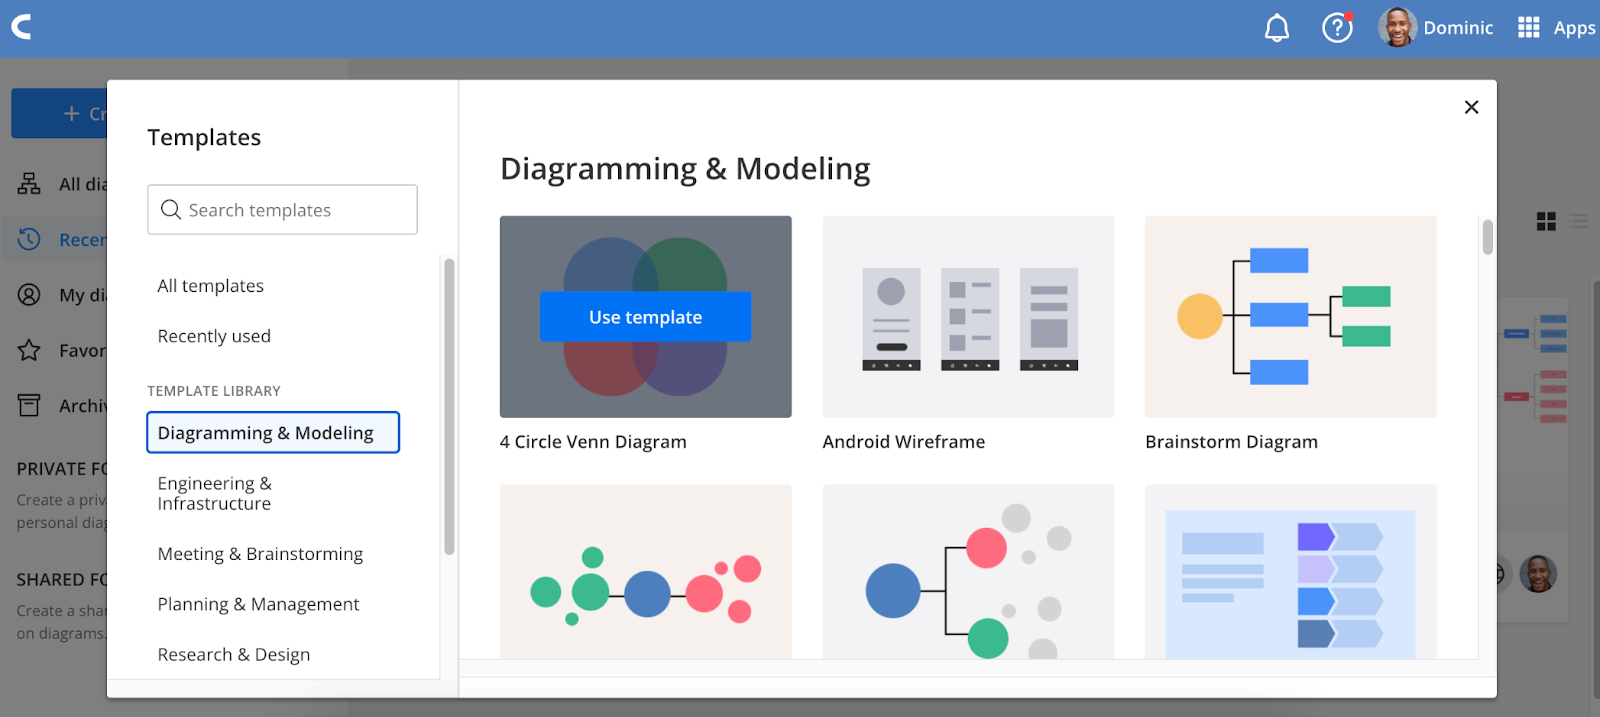
Cacoo’s Venn diagram templates can be found under the Diagramming & Modeling category, or you can search “Venn diagram” to see all three. Choose the Venn diagram template that best suits your project: there are options for Venn diagrams with two, three, or four circles. Hover your cursor over the template you’d like to use and click Use template.
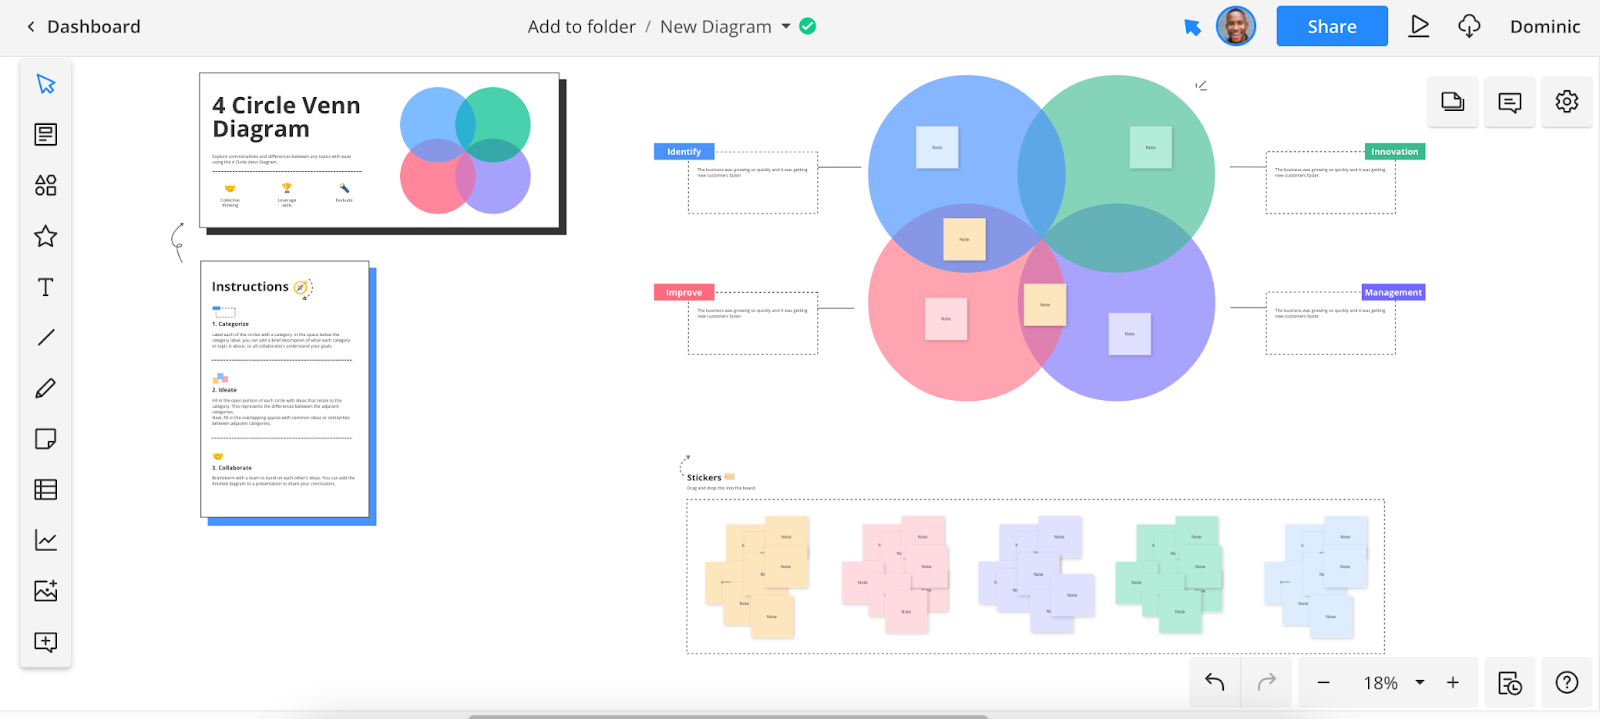
Your diagram will open up. You’ll see a Venn diagram populated with example content, instructions, and sticky notes that you can attach to your diagram. Over the next few steps, we’ll explore how you can start customizing this template to fit the exact needs of your project.
Note: if you decide to create your own Venn diagram from scratch, the next step of this process includes all the details you need to get started.
Step 2: Add shapes and text
Adding shapes, text, and connectors helps customize your diagram to the unique considerations of your project. Cacoo, with its intuitive drag-and-drop user interface, makes it easy for users to add all of these elements to their diagrams.
Shapes, text, icons, and other assets can be added to your diagram using the Cacoo toolbar on the left-hand side of your screen. You’ll find a wide variety of shapes and Venn diagram icons, from simple squares and circles to highly specific technical diagramming assets, and you can even create custom shapes.
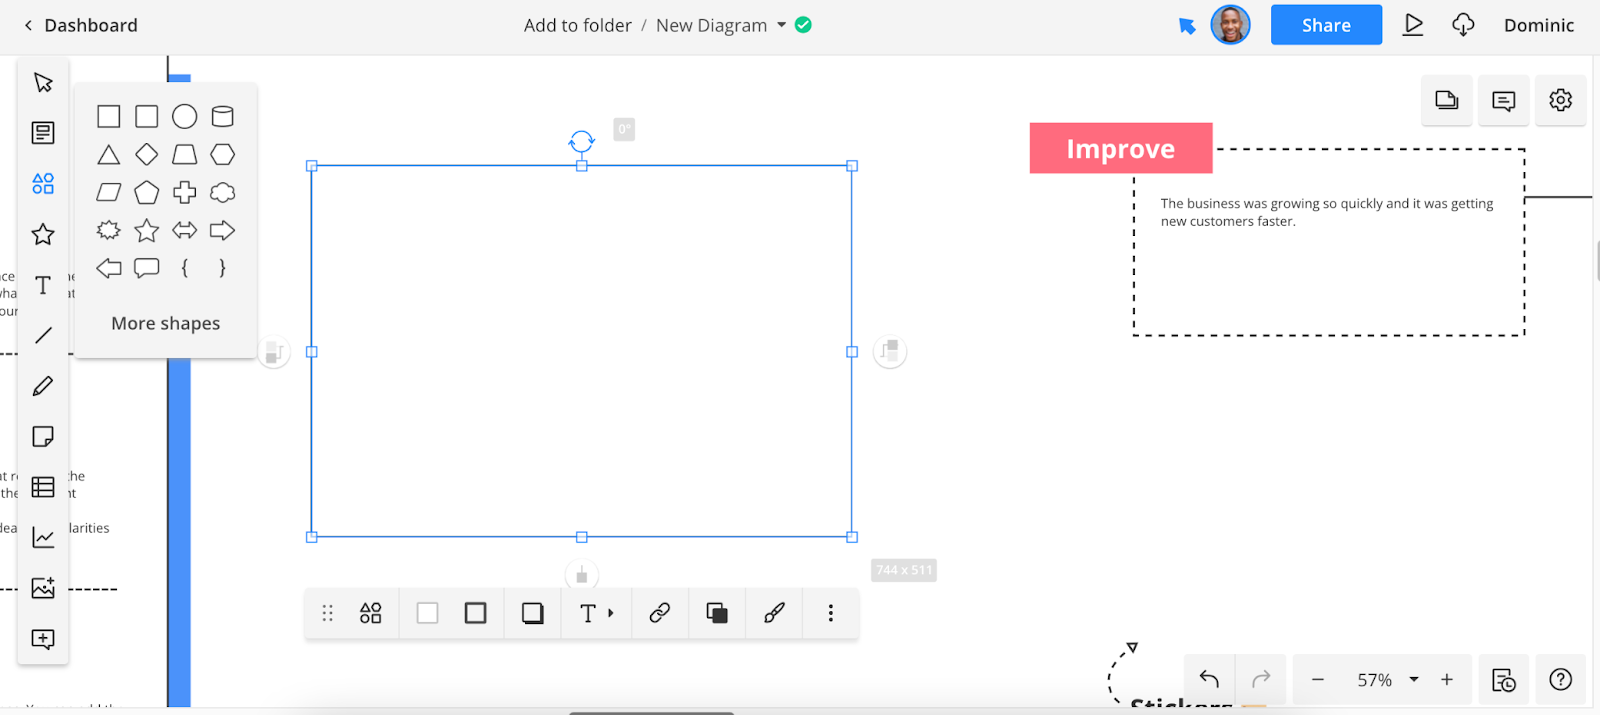
To add a new shape to your diagram, navigate to the toolbar, click the Shape icon, select the shape you’d like to add, and drag and drop it onto your diagram. At first, your new shape might seem a little out of proportion to your Venn diagram, but don’t worry; it’s easy to resize it.
To resize your shape, click on one of the squares on the side of the shape and use the drag-and-drop feature to make your shape the perfect size. You can change your shape’s vertical or horizontal dimensions or click on one of the corner squares to dynamically change both simultaneously.
Users can also rotate shapes by clicking on the rotate icon. As you move the shape around your diagram, grid lines will appear that make it easy to understand when the selected shape is aligned with other elements, helping you format your diagram.
The toolbar that appears below each shape allows users to update the background color, border, and opacity of the shape. This is particularly helpful for color-coding shapes to match the unique colors of your Venn diagram. Add the Hex numbers of your brand colorways for a consistent look and feel.
Adding text to a Cacoo Venn diagram
Adding the correct shapes to your Cacoo Venn diagram is important, but adding text is even more important. This text documents the rationale and detail behind your ideas, bringing Venn diagrams to life and helping you use them as a tool to explain complicated ideas.
Our Venn diagram templates come with pre-configured text boxes outside of each circle where you can easily enter new ideas. You’ll find familiar features to format your text in the toolbar that appears below each text box. In this toolbar, you can:
- Change fonts
- Update font sizes
- Tweak font colors or highlight text
- Add formatting, including bold, italics, and underlining
- Add a hyperlink to the text

If you’d like to add more text outside the existing text boxes, that’s easy too! You can enter text in every shape you create: just click on it and start typing. Alternatively, you can add new text boxes anywhere on your Cacoo diagram. To do so, click the Text (T) icon in the toolbar and place your text box exactly where you need it.
Step 3: Arrange and group shapes
Next up, it’s time to rearrange and group the shapes on your Venn diagram to better illustrate the similarities and differences between the different concepts represented on your Venn diagram. The whole point of Venn diagrams is that your shapes overlap – to do that effectively, you need to understand how to move them around your diagram.
We already explained using Cacoo’s drag-and-drop editor to move shapes around your diagram. Another key element of Venn diagrams is ordering shapes to create the desired overlap.
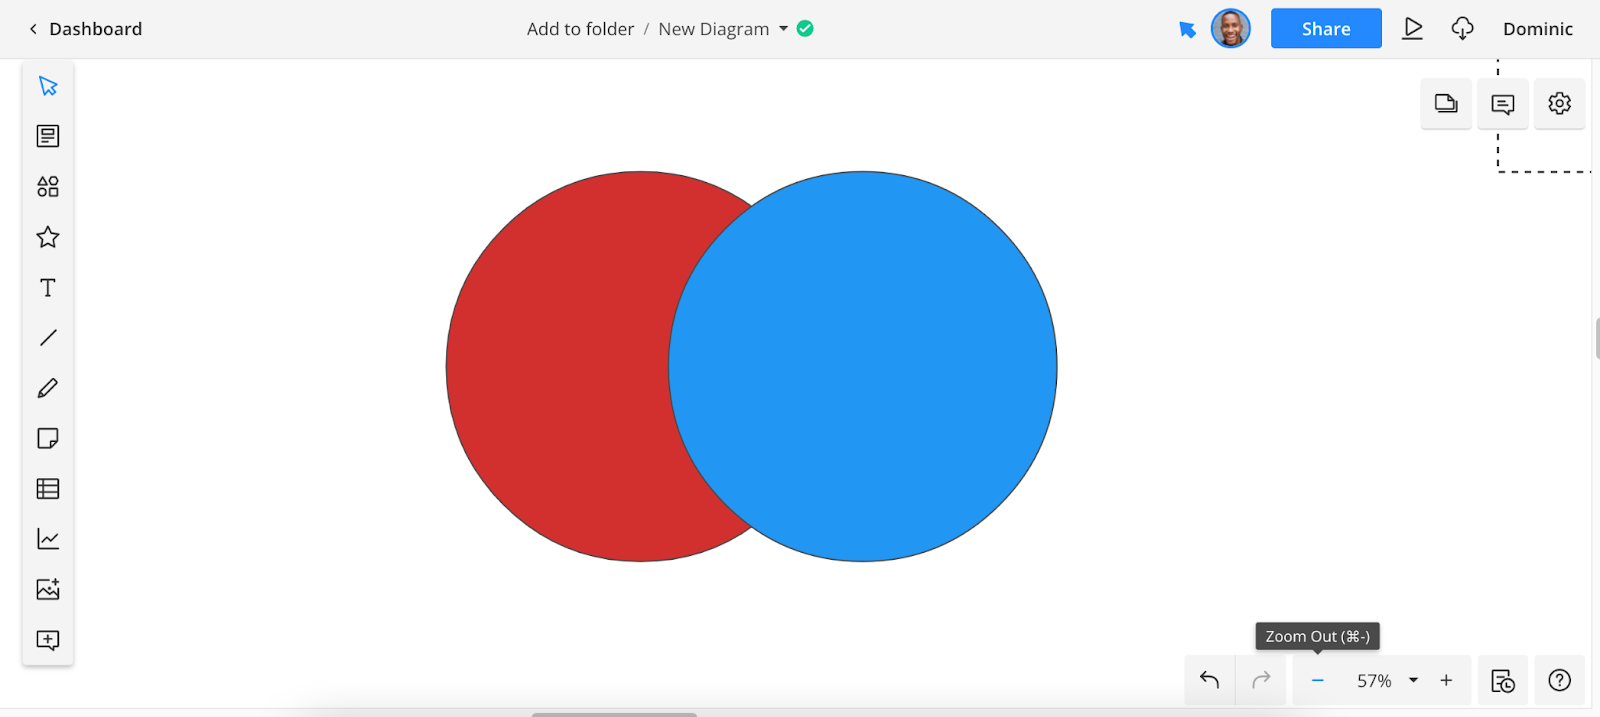
In the image below, you see two shapes: a red circle and a blue circle. This screenshot overlaps the blue circle on top of the red circle. While there is an overlap, it’s the same color as the rest of the blue circle. Clearly, this won’t work as a Venn diagram.
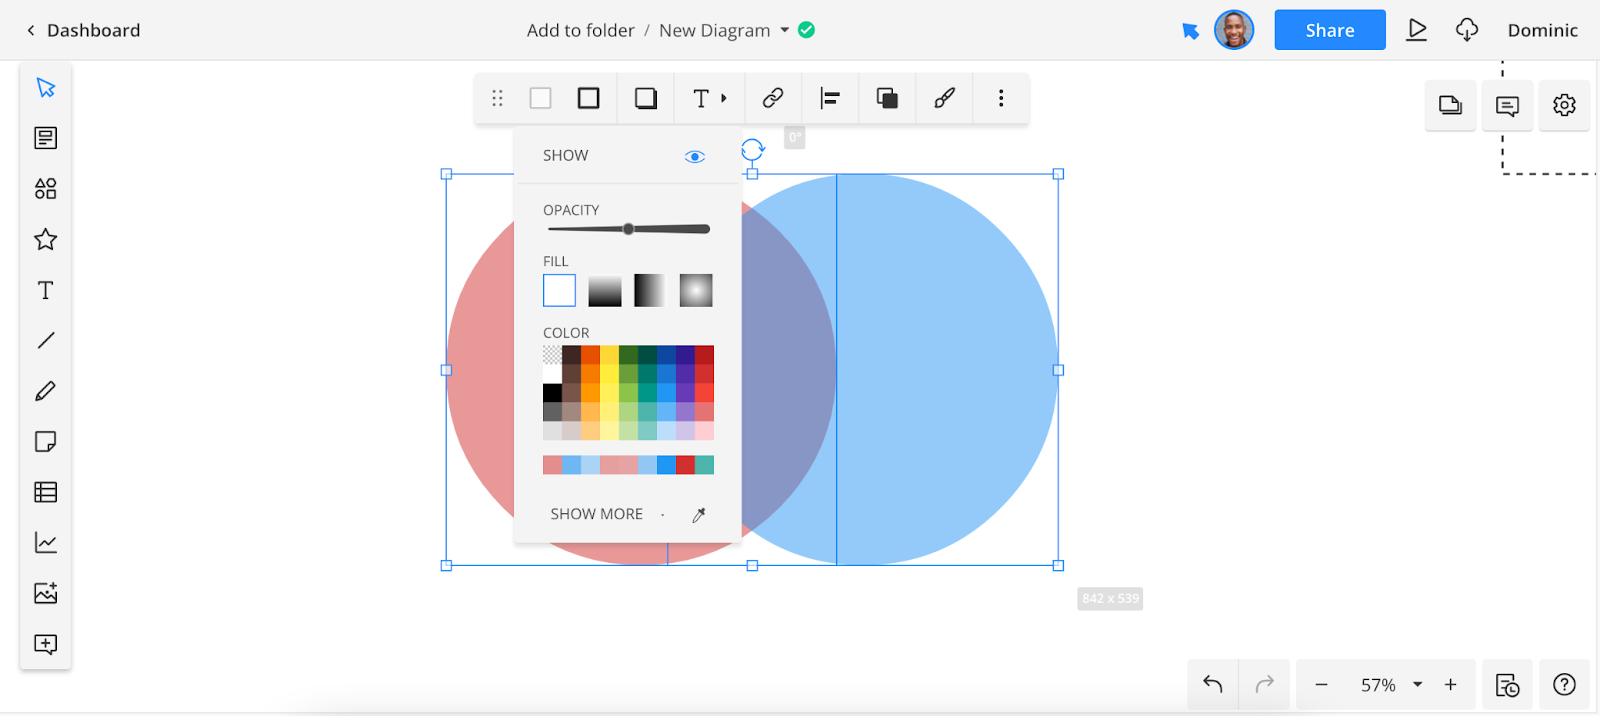
So, how can you edit these shapes to look more like a Venn diagram? The key lies in editing the opacity of your shapes. In Cacoo, that’s easily done. Drag your cursor over both shapes, selecting both simultaneously. In the toolbar next to the shape, click the Fill icon and adjust the opacity to around the halfway mark.
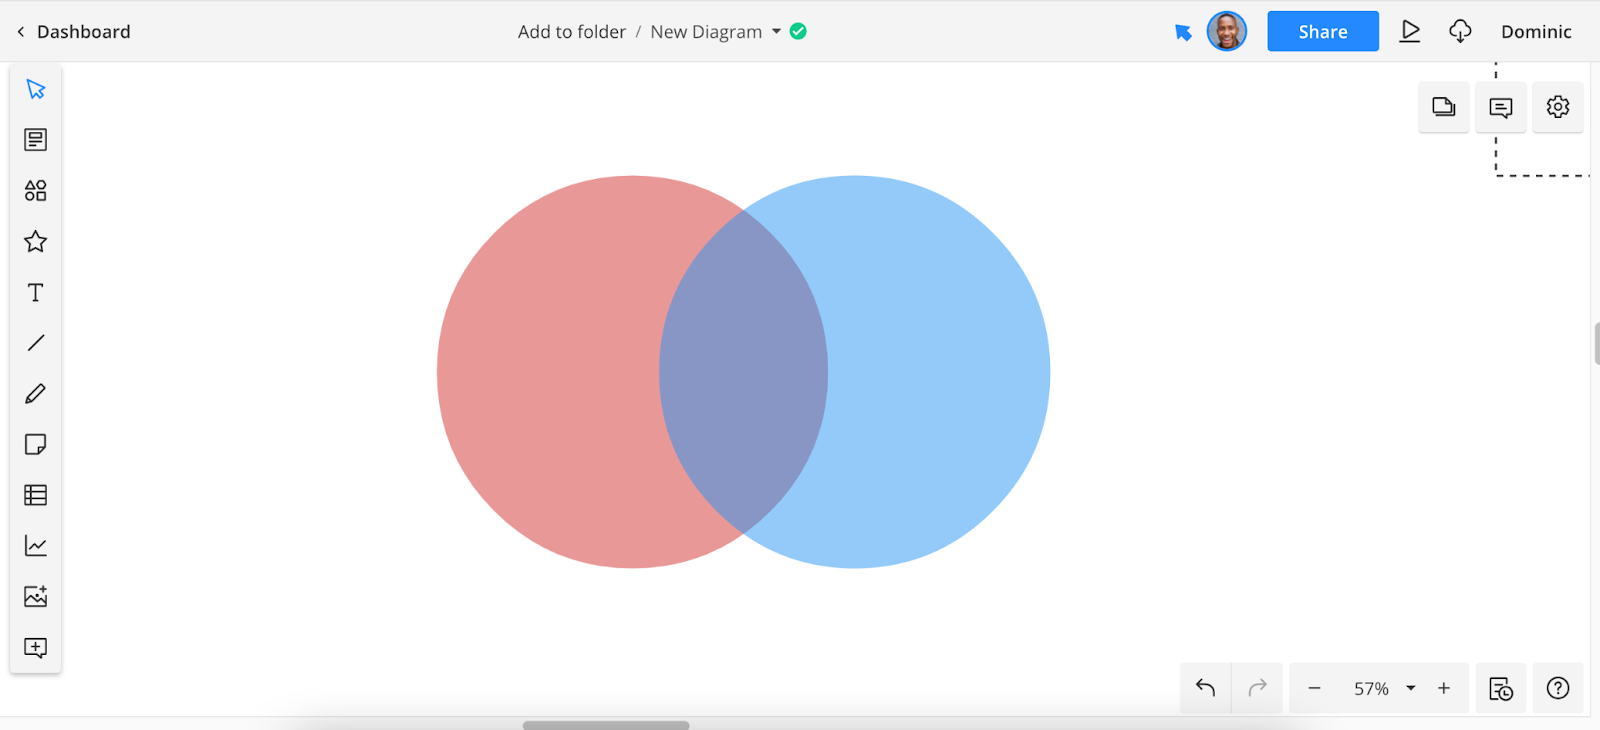
You’ll see that doing so immediately transforms your two circles into the basic structure of a Venn diagram, with a clear overlapping section where you can document the commonalities between the ideas expressed in the two different circles.
This toolbar also has several other options to manipulate the shapes of your Venn diagram. One helpful tool is Stack order. By moving items forward or backward, you can better manage how they are displayed.
Once you’ve got your Venn diagram formatted precisely how you want it, you can lock elements of the diagram to prevent others from changing them without deliberately unlocking them first. This is a particularly useful feature for project managers who want to set up the framework for a brainstorming session and allow their team to add new ideas without editing the core structure of the Venn diagram.
Step 4: Add labels and legends
To help others understand your Venn diagram, you must code the information in the diagram by adding elements such as labels and legends.
Every shape you create should have a clear label, as should all of the intersections between the different areas of your Venn diagram. There are a couple of different ways for users to add labels to their Cacoo Venn diagrams:
- Sticky notes: Cacoo’s pre-configured Venn diagram templates already contain sticky notes on many of the sections and intersections of the diagram – all you have to do is click on them to add text unique to your diagram. However, you can also add your own sticky notes by dragging and dropping them from the toolbar or by using the sticky notes available in the Stickers section of your template.
- Add a text box: If you don’t have the space for a sticky note, a text box, either inside or outside of the area you want to label, might be a better choice. Text boxes can also be dragged and dropped from the Cacoo toolbar. If you place them outside of the element you want to label, we recommend adding connectors and color-coding your labels to make them easier to understand.
Adding connectors is simple: just navigate to the toolbar on the left of your screen, click the Line (L) icon, choose the type of line you’d like (straight, curved, corner, etc.), and draw the connector between the elements you want to connect. Resizing and moving your connectors works the same way as resizing and moving shapes – just drag and drop until everything is exactly where you need it to be!
Alongside labels, you might also consider adding a legend to your diagram: a simple table that illustrates what different colors, shapes, and symbols represent.
To create a legend, use Cacoo’s Table creation tool. From the left toolbar, click the Table icon, and then choose the table size you need. If you’re unsure what the right size is, don’t worry – adding or subtracting rows and columns later is easy.
Enter the relevant information into each row of your table. To show you how this works, let’s revisit the simple Venn diagram we created in the last section.
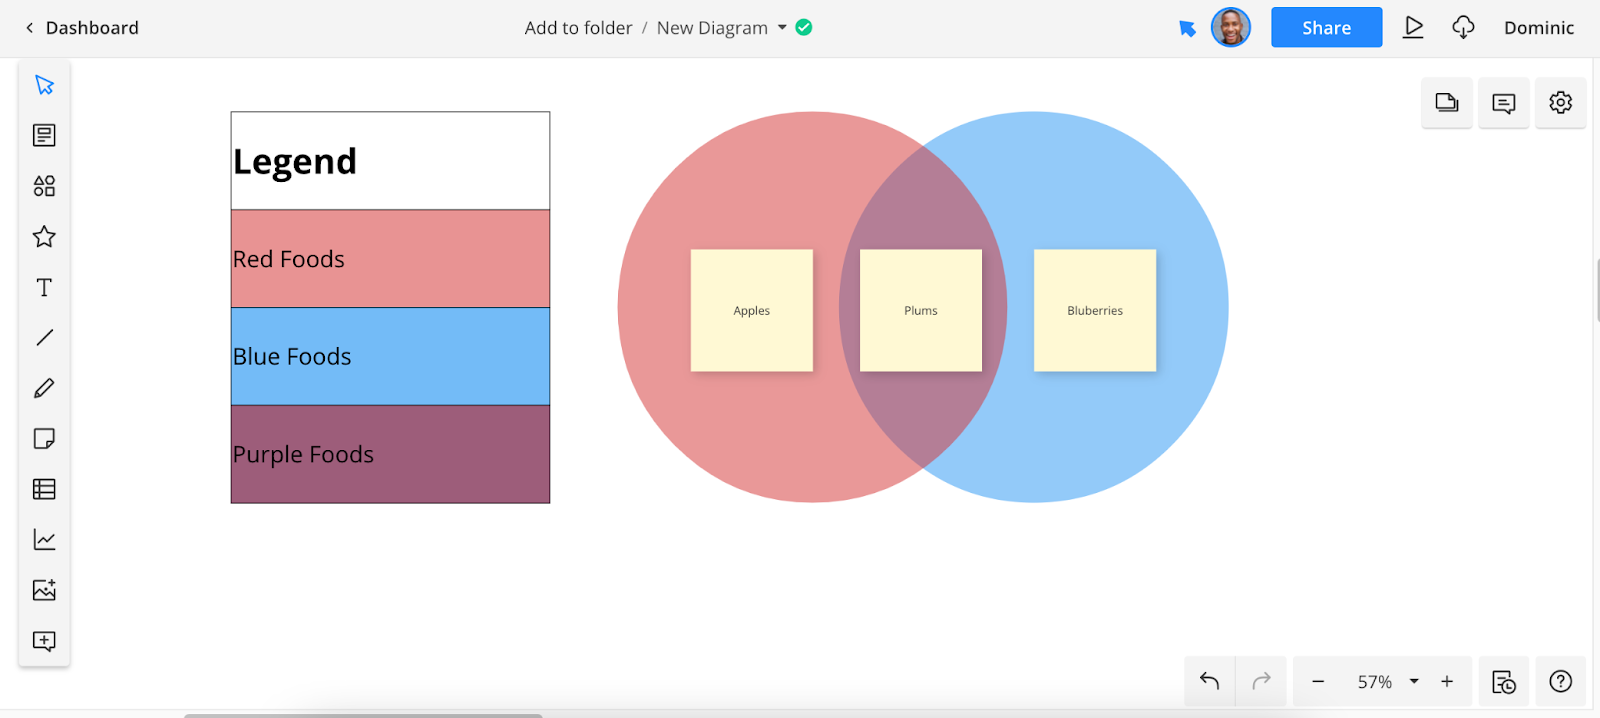
In this Venn diagram, we tackle a very important topic: red, blue, and purple foods. An apple is a red fruit, blueberries are, well, a blue fruit, and plums are a purple fruit – a mix of red and blue. To make it clear to our users, we’ve included a simple legend that illustrates what each section of the Venn diagram represents.
Now, if someone comes along and needs to sort a tomato into this chart, they can easily understand where it should go rather than guessing what the categories refer to. While this is clearly a simplified example, it’s an approach that works just as well for complicated topics.
Step 5: Share and collaborate on the diagram
While you can create your Venn diagram alone, inviting your teammates or colleagues to share their ideas is often best. Cacoo allows multiple users to work together on the same Venn diagram in real time.
Here’s an overview of some of the platform’s most useful collaboration features.
Inviting new users to contribute to your Venn diagram
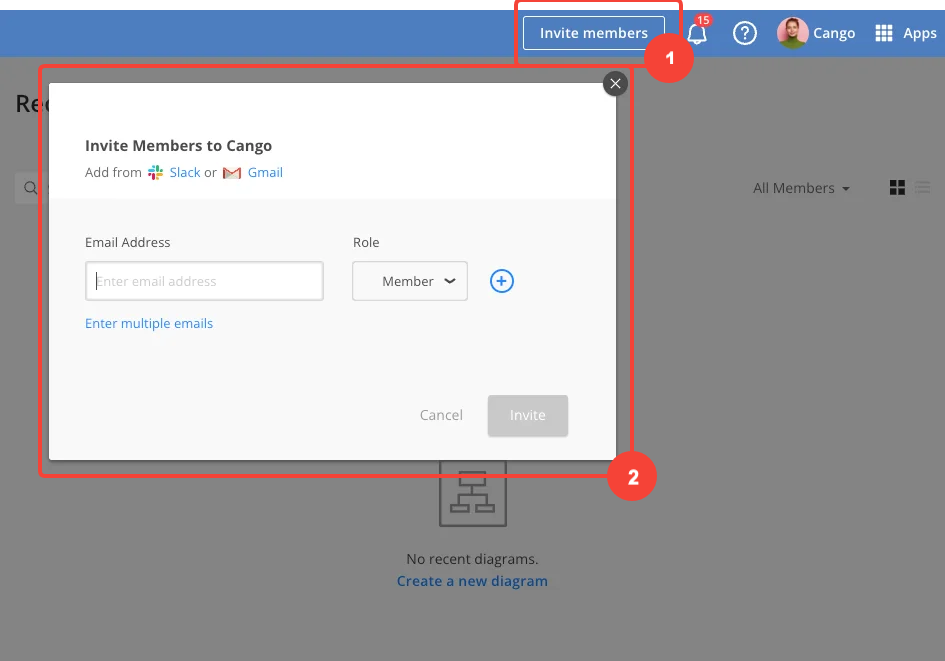
Cacoo is built for teamwork, so it should come as no surprise that it’s easy to invite new users to view and edit your Venn diagram. Administrator-level accounts can invite new users to your organization’s Cacoo account by clicking the Invite members button on the Cacoo dashboard, specifying the role of each member.
If you just need to share an individual diagram with someone, Cacoo offers several options:
- Home: From the Cacoo dashboard, hover your cursor over the Venn diagram you’d like to share, click the … icon, and then enter the person’s name or email address that you’d like to share the diagram with.
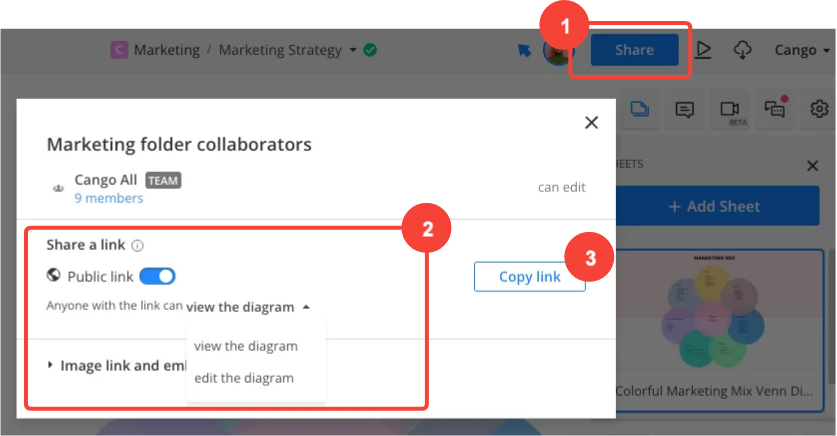
- Link: From your Venn diagram, click the Share button and then toggle on the Public link radial button. You can specify whether the people you share the diagram with can edit or can only view the diagram. Click the Copy link button to add the link to your device’s clipboard.
- Embed: Cacoo diagrams can be embedded into external intranet pages or wikis. Just follow the steps in the previous bullet point, but this time, copy the embed link and paste it wherever you’d like your Venn diagram to appear.
Using the chat, comment, and revision history features
Every Venn diagram you create in Cacoo comes with a range of collaboration tools built-in, including:
- Chat and video call: Click the chat icon to start a diagram-specific message thread or start a video call with colleagues to go over more complex issues.
- Comment: Attach comments to specific elements of your Venn diagram and tag team members for review: they’ll receive a notification that you’d like their input.
- Revision history: Understand how your Venn diagram has evolved and revert to previous versions by clicking the Revision history icon in the bottom-right corner of your diagram.
Exporting and printing your diagram
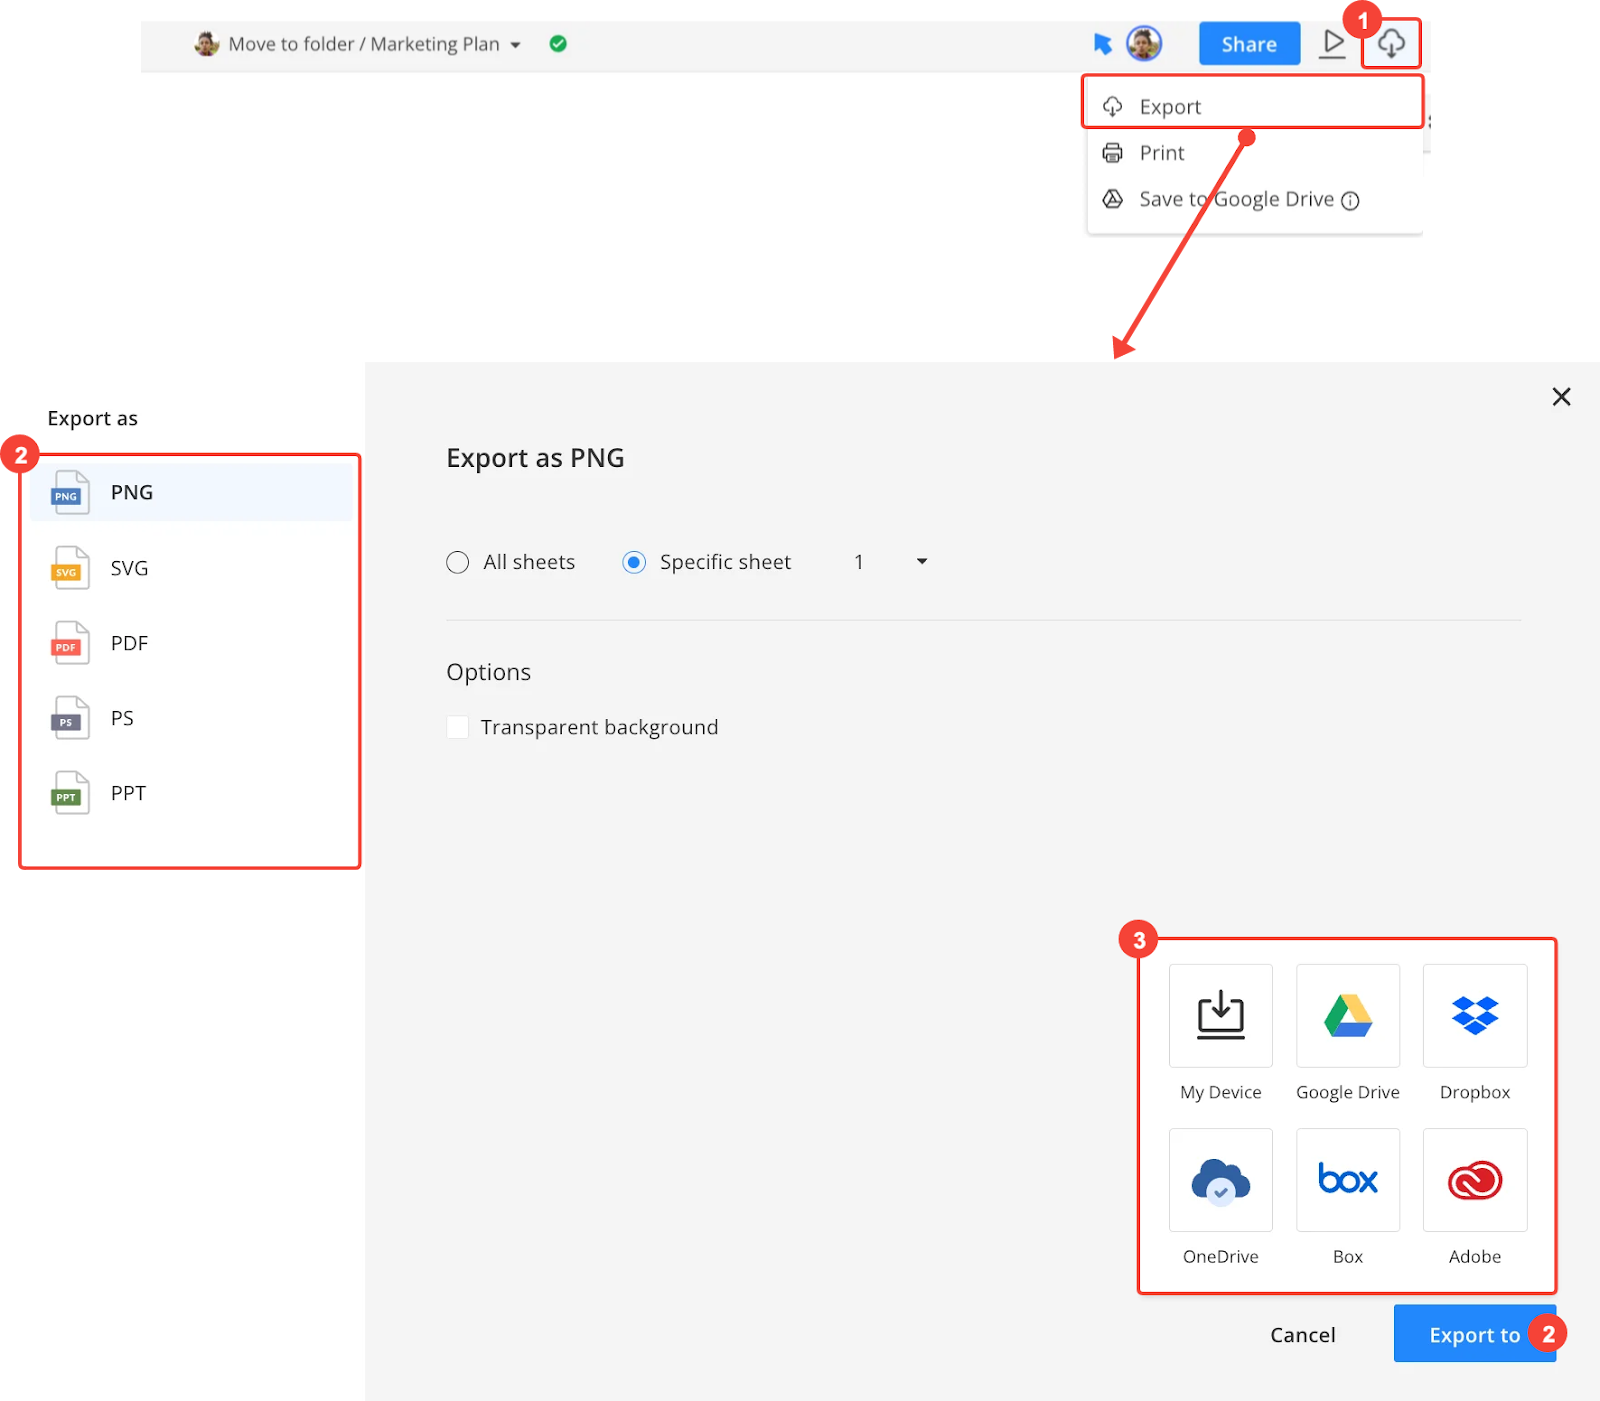
Share your Venn diagram offline by exporting it from Cacoo in various formats, including PPT, PDF, SVG, and more. Just tap the Export icon on the top-right corner of the menu bar and select the format you’d like to export your diagram in and the destination you’d like to export it to.
Users can also print their Venn diagrams directly from Cacoo by selecting the Print option.
Create your first Venn diagram in Cacoo today
With Cacoo, creating a Venn diagram is a breeze. Cacoo provides a simple, intuitive experience, making it easy for you to quickly build the basics of your Venn diagram so that you can spend time collaborating with your team on the content of your diagram.
It’s free to get started: activate your free Cacoo account now to start building your first Venn diagram.
About Author

Cacoo Staff
Guest authorCacoo by Nulab is the collaborative diagramming software for modern teams. Use it for project diagrams, workflow planning, brainstorming, online whiteboarding, presentations, and more to keep your team on the same page.

![[INFOGRAPHIC] Working remotely? Perfect your home office setup with these tips](https://cdn.nulab.com/learn-wp/app/uploads/2020/03/14210930/Cacoo-Home-office-setup-infographic-blog-680x451-1.png)


