
When looking back at the Venn diagrams you created in grade school, you probably have fond memories of charting which types of candy bars you and your friends liked or comparing your favorite movie characters. While you may have thought your Venn diagramming days were long behind you, these tools are actually useful throughout adulthood. In fact, the Venn diagram symbols you know so well aren’t just a creative whim.
Mathematicians and related professionals use Venn diagram symbols to represent complex relationships and solve mathematical problems all the time. Of course, the topics in professional diagrams usually aren’t candy bars or movie characters. And there’s a lot more you need to understand to use them effectively.
To fully embrace the world of professional Venn diagrams, you should have a basic understanding of the branch of mathematical logic called ‘set theory’ and its associated symbols and notation. Using set theory, researchers and mathematicians have established the foundations of many mathematical concepts. For instance, diverse sets of structures, relations, and theorems can all be applied to various areas of study, including topology, abstract algebra, and discrete mathematics.
Using the basics we’ll cover here, you, too, can begin using Venn diagrams in more complex ways.
Venn diagram symbols
While there are more than 30 symbols in set theory, you don’t need to memorize them all to get started. In fact, the following three are the perfect foundation.
The union symbol ∪
Venn diagrams consist of a series of overlapping circles, each circle representing a category. To represent the union of two sets, we use the ∪ symbol — not to be confused with the letter ‘u.’
In the below example, we have circle A in green and circle B in purple. This diagram represents the union of A and B, which we notate as A ∪ B.
Let’s revisit those grade school days for a moment with that example of candy bars. If circle A included people who like Snickers bars and circle B listed people who like 3 Musketeers bars, A ∪ B would represent people who like Snickers, 3 Musketeers, or both.
The intersection symbol ∩
The area where two sets intersect is where objects share both categories. In our example diagram, the teal area (where green and purple overlap) represents the intersection of A and B, which we notate as A ∩ B.
This intersection is the area where we would find people who like both Snickers and 3 Musketeers.
The complement symbol Ac
The categories not represented in a set are known as the complement of a set. To represent the complement of set A, we use the Ac symbol.
To represent the absolute complement of a set (i.e., everything not included in the set), we use the equation Ac = U \ A, where the letter “U” represents the given universe. This equation means that everything in the universe, except for A, is the absolute complement of A in U.
The gray section of our example diagram represents everything outside A.
Using our candy bar example, this would represent everyone who does not like Snickers.
Another Venn diagram example
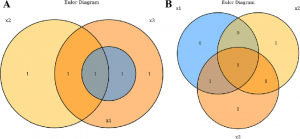
Now, we’ll try a new example. Let’s say we’re planning a party at work, and we’re trying to figure out what kind of drinks to serve. We ask three people what drinks they like. Here are the answers we get:
| Drink | A | B | C |
| Wine | X | X | X |
| Beer | X | X | |
| Martini | X | X | |
| Old Fashioned | X | X | |
| Rum & Coke | |||
| Gin & Tonic |
Using a three-circle Venn diagram, we can cover every possibility. Each person is represented by a circle, symbolizing them with A, B, and C. Using the ∩ symbol, we can demonstrate where to place the intersections between sets.
When we fill in the diagram with our data, we place each object according to the formulas we indicated above. For example, we place the Martini in the B ∩ C area because respondents B and C indicated they enjoy them. Because Rum & Coke and Gin & Tonics weren’t selected by anyone, they do not go within any circle. However, because they still exist and are available in the universe, we can place them in the white space.
Here’s our final diagram:
Clearly, wine is the best choice for our upcoming party. Beer, martinis, and old fashioneds may be good secondary drinks to offer, but they probably shouldn’t serve rum & cokes or gin & tonics.
More Venn diagram examples
By looking at these examples and all the Venn diagram symbols you’ve learned, you can dive into making the visuals that will help your team.
Political party Venn diagram example

Marketing landscape Venn diagram example

Here are a few more light-hearted examples to check out if you still want more.
Venn diagram templates
Once you’re ready to start building your own diagrams with Venn diagram symbols, Cacoo has many templates to get you started.


How to read a Venn diagram
Now that you know how to make a Venn diagram and include the official terminology and symbology, you should understand how to correctly read one.
By reverse engineering, you can take the information already in the diagram to see where the symbols and equations we’ve laid out would go. No matter how many options you add, you’ll know how to identify similarities or preferences and the differences between elements that sit inside or outside the chart.
Set theory
While we could go extremely in-depth on set theory (there’s always more to learn), a fitting way to finish off a lesson on Venn diagrams is by learning some of the theory behind them.
A set is a group or collection of things, also known as elements. Those elements could really be anything. From the example above, the set consists of the choices the unnamed group makes for their drink preferences.
In set theory, we would write this out instead as an equation, listing all of the elements within curly brackets:
{person 1, person 2, person 3, person 4, …}
Since the question of the example is which drink their preference is, these people end up divided into groups by their choices:
- Old fashioned = {X people}
- Martini = {X people}
- Beer = {X people}
- Rum & coke = {X people}
- Gin & tonic = {X people}
Because we’re offering five different drink options, we end up with five individual sets, which are then represented within the Venn diagram.
Venn diagrams vs Euler diagrams
If you’ve ever seen an Euler diagram, you may be wondering if Venn diagrams are merely the same thing by another name. While they’re similar and both based on set theory, they represent different types of relationships.
Venn diagrams chart all the possible, logical relationships between a set of items. And as we already discussed, the resulting diagram may include empty spaces in which there are no relationships. Euler diagrams, or Eulerian circles, depict real-world relationships and subset categories that exist within each. Euler diagrams have no blank intersections, as they only show definite relationships.
The simplest form of Euler diagram typically includes two circles side by side, each listing a category. Smaller subset circles go inside each category. For instance, if you were comparing footwear, the categories could include “boots” and “sneakers.” Possible subsets of boots include “high-heeled” and “snow,” while sneaker subsets could include “running” and “high-top.”
Euler diagrams could have many intersecting circles, but they don’t have to if the categories don’t share any subsets. Going back to the previous example, “wedge” would be a subset of both “boots” and “sneakers,” but “Chelsea” would only apply to “boots.”
One reason why Venn and Euler diagrams seem similar is because they have related origins. When John Venn published his theories on Venn diagrams in 1881, he referred to them as Eulerian circles, based on the 18th-century findings of Leonhard Euler.
Venn diagram maker
We’ve stuck to basic examples here for the sake of clarity, but there’s a lot more information out there you can use for a deeper understanding of set theory. In fact, Stanford’s encyclopedia entry on set theory is a great place to start.
As you explore more set relationships, visualizing your work with Venn diagrams is a powerful and easy way to communicate these relationships with ease.
When you’re ready to start using Venn diagram symbols to create your own diagrams, look no further than our cloud-based diagramming tool Cacoo. Our library of shapes can help you easily create diagrams from scratch or you can start from one of our hundreds of pre-made templates to simply plug in your info and go.
This post was originally published on September 11, 2018, and updated most recently on May 10, 2024.
About Author

![[Flowchart] A holiday gift guide: flowchart style](https://cdn.nulab.com/learn-wp/app/uploads/2018/12/14210321/Gift-Guide-blog-image2-680x450-1.png)
![[Flowchart] What Thanksgiving side dishes should you bring?](https://cdn.nulab.com/learn-wp/app/uploads/2019/11/14210711/Cacoo-Flowchart-What-thanksgiving-side-dishes-should-you-bring-this-year_-Blog.png)
![[Flowchart] What should I be for Halloween?](https://cdn.nulab.com/learn-wp/app/uploads/2019/10/14210641/Cacoo-what-should-i-be-for-halloween_-Blog.png)

