
To-do lists are great, but when it comes to the multi-task, multi-person world of project management, a simple list just won’t cut it. Luckily, project managers have an array of tools and techniques at their fingertips to help them tame the task list. One of the best is Kanban, specifically, Kanban flow — the movement of tasks through the business process. Let’s take a closer look at this project management essential.
What is Kanban?
The Kanban concept hails from the busy automotive assembly lines of Toyota back in the 1940s. Back then, it helped ensure nobody was overwhelmed with work and the right parts were always in the right place at the right time.
Today, it’s being used everywhere, from small startups to giant corporations, helping teams visualize their work, balance their workload, and get stuff done efficiently.
Whether you’re a teacher planning lessons, a programmer developing software, or a parent organizing chores, you can use Kanban to keep track of your tasks, manage your time more effectively, and — here comes the best part — reduce stress and work overload. What’s not to like?
How does Kanban work?
It’s actually really straightforward. Picture a large chalkboard divided into three simple columns: “To Do”, “In Progress”, and “Done”. In the world of Kanban, these columns are your main stages of work. Now imagine writing all your tasks on sticky notes of different colors and placing them in the “To Do” column. Each sticky note is a task waiting for an owner.
Let’s say you pick up a task. You move its sticky note to the “In Progress” column. This move tells everyone (and reminds you) that you’re currently working on that task. Once you’re done, you move it to the “Done” column.
This is a basic Kanban workflow board and depending on the complexity of your work, you might need more columns. For example, if you’re a writer, your Kanban board could have columns like “Ideas,” “Outline,” “Writing,” “Editing,” and “Published.” The secret is to map out your workflow to reflect the journey each task takes from start to finish.
Detail is important, but remember that simplicity is what we’re going for here. A key aspect of Kanban is limiting the amount of work in your “In Progress” column. This stops you from getting swamped with too many tasks while helping you stay focused on a few tasks that you give your all. It also makes it easier to spot where tasks get stuck or delayed, which means you can address bottlenecks faster.
What is Kanban flow, exactly?
Kanban flow describes the regulated movement of tasks across the Kanban board. It encapsulates the lifecycle of a task from inception to completion, mapping its journey through different stages of the workflow. The central goal of Kanban flow is to ensure a smooth and continuous progression of work, avoiding blockages, delays, or pile-ups.
The concept of Kanban flow is rooted in a fundamental Kanban principle: limiting work in progress (WiP). By only allowing a certain number of tasks within each stage of the process, teams can better manage their workload and avoid overloading. This helps you finish what you started, which clears space for new tasks to enter the workflow.
Transparency in tasks
By visualizing the entire workflow, everyone can see exactly who’s working on what and where potential bottlenecks are forming. This transparency helps teams address problems promptly and keeps everyone focused on both their individual tasks, as well as the bigger picture.
Kanban flow also promotes a culture of continuous improvement. By consistently reviewing and refining the flow of tasks, teams can learn from past experiences, spot areas of improvement, and optimize their workflow. The goal isn’t just to maintain a steady flow of work but to make that flow more effective over time.
Kanban flow metrics: Measuring the pulse of progress
So you know what flow is. But how do you optimize it? This is where metrics come in. To optimize your Kanban flow, you’ll need to track certain figures that give you insight into the efficiency of your workflow.
Think of them as being like the vital signs of your Kanban system, helping you monitor its health, ensure steady progress, and spot issues early on. Here are a few key Kanban flow metrics for starters:
Cycle time
This is the total time taken for a task to move from the start of the workflow (the moment work actually begins on it) to the end (when the work is completely done). It’s a direct measure of the speed of your workflow. Tracking cycle times helps you identify trends and variations in task duration. With this data, you’ll be in a better position to make accurate resource estimates and spot opportunities for speeding up the workflow over time.
Work In Progress (WIP)
WIP refers to the number of tasks that are currently in the “In Progress’ stage. Limiting WIP is a central tenet of Kanban, as it prevents overloading and keeps teams focused on completing tasks. Monitoring WIP can help you maintain a healthy task balance and identify bottlenecks in the workflow.
Throughput
This refers to the number of tasks your team completes over a set time period. It gives you a bird’s eye view into their productivity, as well as insight into how well the overall workflow is doing. It also helps you spot patterns, like specific days of the week when throughput is especially high or low. Armed with this data, you can manage resources more effectively.
Lead time
Lead time measures the total between a task being added to the board (even if work hasn’t begun yet), to when it’s marked as “done”. It gives you an indication of the overall time a customer or team member might expect a task to take. Not only does this help you with scheduling and resource management — it also means you can make smarter estimates, which, in turn, boosts customer confidence.
Cumulative flow diagrams are your secret weapon
A Cumulative Flow Diagram (CFD) is a visual tool that shows you the number of tasks in each stage of the workflow over a set time period. It gives you a snapshot of how tasks are moving through the system, which makes it easier for you to spot bottlenecks or other issues affecting task flow.
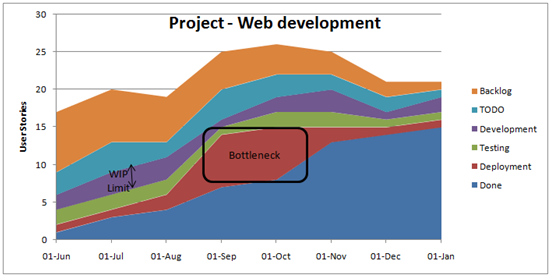
Image Source: worldofagile.com
A typical CFD consists of a graph where the horizontal axis represents time, and the vertical axis represents the number of tasks. The colored bands represent each stage in your workflow. The width of each one shows the number of tasks in that stage at a given time. As tasks move from one stage to the next, you’ll be able to see the changes in the widths of these bands.
Here’s how to interpret these elements
Assessing workload
Look at the vertical distance between the bottom and top of the colored bands at any point on the graph. This distance represents the total Work in Progress (WIP) at that point in time. If this distance remains relatively consistent over time, it indicates that the inflow and outflow of work are balanced.
Identifying bottlenecks
If you spot one of the bands widening over time, it means tasks are accumulating in that stage. This could be an indication of a bottleneck, showing that tasks are entering this stage faster than they’re leaving.
Checking delivery rate
The slope of the top line of the diagram (representing the ‘Done’ tasks) tells you the delivery rate or how fast tasks are being completed. If this line rises steadily, tasks are being completed regularly. If it flattens, it means tasks are not getting done. Time to investigate!
Checking arrival rate
Similarly, the slope of the bottom line (representing tasks added to “To Do”) shows the arrival rate or how fast new tasks are being added to the workflow. A steadily rising line indicates a consistent rate of new tasks being added.
Estimating lead time and cycle time
The horizontal distance between the start and end points of a task in the graph represents its lead time, while the distance from when it starts being worked on to when it’s completed represents the cycle time.
Evaluating consistency
Ideally, the colored bands in a CFD should be roughly parallel to each other. This shows that tasks are moving smoothly from one stage to the next. If the bands start to diverge or converge, it’s a sign that the flow of work might be inconsistent and requires a closer look.
How to optimize your Kanban flow
Here are some steps to help you structure your Kanban flow:
Visualize your workflow
Start by mapping out your process from beginning to end. Each stage of your work process should have its own column on the board, creating a clear pathway that tasks follow.
Define work items
Be clear about what constitutes a single piece of work or a task. Each task should be meaningful enough to deliver value when completed but not so large that it becomes a project on its own.
Limit Work in Progress (WIP)
Too many tasks in the “In Progress” at once will lead to bottlenecks and reduce focus. Set a limit for how many tasks can be in each stage at any given time. These WIP limits should be adjusted over time based on your team’s capacity and the nature of the work.
Manage flow
Pay attention to the movement of tasks across the board. If tasks are piling up at a certain stage, investigate the reason and find ways to smooth the flow.
Make policies explicit
Clear guidelines about when and how to move tasks from one stage to the next will prevent confusion and keep things consistent. These policies should be clearly visible and well communicated to all involved.
Implement feedback loops
Regularly review and adapt your process. Hold meetings to discuss what’s working and what isn’t, and use this feedback to make improvements.
Use metrics
Cumulative flow diagrams give you direct insight into the health and efficiency of your Kanban flow. Use these metrics to stop bottlenecks forming, analyze trends, and gauge the effectiveness of your changes.
Collaborate and evolve
Kanban flow is not a set-it-and-forget-it system. Encourage team collaboration and continual evolution of your Kanban system to better meet changing needs.
Different needs, different boards
Your Kanban board should be a mirror, reflecting the unique needs of your work landscape. Let’s take a look at some Kanban board examples for different industries.
Software development
Kanban and code go together like pizza and movie nights. The world of software development is full of complexities, with tasks often having multiple stages of progress, from design and coding to testing and review. A Kanban board for this environment should therefore be divided into several columns to accommodate these stages. These typically include “Backlog”, “Design”, “Development”, “Testing”, “Review”, and “Done”.
Content marketing
Content marketing thrives on creativity and strategy, and a well-designed Kanban board can be the ideal tool to manage both. In this setting, a Kanban board might be structured with stages like “Ideas”, “Outline”, “Draft”, “Review”, “Edit”, and “Published”.
The “Ideas” column is a breeding ground for all content ideas. Once the team is ready to work on an idea, it moves to the “Outline” stage where they then shape the initial content structure. It then goes through “Draft” and “Review” stages, getting iterative improvements until it’s polished and ready for the audience in the “Published” stage.
Construction management
In the hands-on world of construction, a Kanban board can act as a blueprint, organizing complex tasks and teams. It might include stages like “Planning”, “Procurement”, “Foundation”, “Structure”, “Finishing”, and “Inspection”.
The “Planning” column could include things like architectural design and permit acquisition. The ‘’Procurement’ section might involve sourcing and purchasing the necessary materials. Columns like “Foundation”, “Structure”, and “Finishing” map out the actual construction process, from laying the foundation to putting on the finishing touches, while the “Inspection” stage ensures that all work meets the necessary safety standards and quality benchmarks before the project is marked as complete.
Retail operations
In the customer-centric world of retail, a Kanban board can help teams keep track of myriad tasks, from stocking shelves to handling customer queries. A retail-oriented Kanban board might have stages like “Inventory Check”, “Reordering”, “Stock Arrival”, “Shelf Stocking”, “Customer Service”, and “End of Day Procedures”.
“Inventory Check” would involve tasks related to checking stock levels, while “Reordering” would include tasks for placing orders for items that are running low. “Stock Arrival” tracks the incoming items, and “Shelf Stocking” monitors the process of getting those items onto the store shelves. “Customer Service” could include tasks related to helping shoppers, handling returns, or dealing with queries, while “End of Day Procedures” covers tasks related to closing the store, like counting the cash drawer or tidying up the shop floor.
Why project management software is your digital ally
When it comes to mastering Kanban flow, project management software offers a host of features designed to simplify, organize, and enhance your process.
Digital Kanban boards
A digital Kanban board brings the traditional physical board into the online space. It offers flexibility, allowing team members to update tasks in real-time, irrespective of their location. This is especially helpful for remote or widely distributed teams.
Automated workflows
Project management is an admin-heavy job — but now, you can let software take the strain. Save time and streamline the process via automated workflows that move tasks across the board based on pre-set triggers.
Integration capabilities
Most project management tools integrate with other tools and platforms your team might be using. This ranges from chat apps to diagramming software, creating a unified workspace.
Real-time updates and notifications
Immediate updates and notifications keep everyone informed about task progress. This reduces the need for meetings, follow-up emails, not to mention lowers the chance of tasks slipping through the cracks.
Customization
Different teams have different needs. The ability to customize your digital Kanban board, whether it’s adding new stages, tagging tasks, or creating sub-tasks, helps tailor the process to your specific requirements.
Documentation
With digital boards, all discussions, files, and decisions related to a task can be stored in one place, creating a single source of truth and making it easier to track task history.
Reporting and analytics
Most project management software provides robust reporting features. From Cumulative Flow Diagrams to burn-down charts, these visual reports help teams track progress, identify bottlenecks, and make data-driven decisions. It also means the longer you use it, the more data you’ll have, and the better you’ll be over time. Why not take Backlog for a spin today?
About Author

Georgina Guthrie
Guest authorGeorgina is a displaced Brit currently working in France as a freelance copywriter. Before moving to sunnier climates, she worked as a B2B agency writer in Bristol, England, which is also where she was born. In her spare time, she enjoys old films and cooking (badly).


