With the amount of information we consume every day, it’s no wonder we prefer visuals to dense text. This is an important consideration when you’re sharing marketing plans with your team. Few people want to read through pages of facts or listen to you explain complex concepts for hours (and they probably won’t). That’s where diagrams come in.
Your audience wants something concise that delivers the information they need quickly. And they want resources they can easily reference in the future.
The best thing about diagrams is that they’re only limited by your creativity. You can use a variety of fun visuals to represent your team’s processes, strategies, and workflow. If the right diagrams don’t exist yet, use simple tools to create them from scratch.
In the meantime, here are a few diagram ideas to get you started.
Flowcharts
Flowcharts are the perfect diagrams for illustrating any process your team follows. From writing content to managing outside requests, outlining key processes lets others know what to expect. Your team can see how different tasks fit together, and they’re less likely to overlook details.

Kanban diagrams
A Kanban diagram is the virtual version of a task board. The diagram consists of columns labeled with project status categories. A typical board shows which tasks are in progress, delayed, upcoming, and finished. But of course, you can add whatever categories make sense for your team.
Kanban tools are so widely known that they’re the basis for many project management programs. When you look at the neatly organized columns, you gain an instant overview of where your project stands. Team members can move tasks to different status categories as they’re completed.
The goal of a Kanban diagram is to improve prioritization. Whenever you review the project status, your team should consider the stakes behind each task. For example, how much value do low-priority tasks bring to the project? Is your backlog getting too large? Do you need more information before moving forward on specific tasks? A daily review helps you to stay on track and maintain high productivity.

Retrospective charts
Similar to a Kanban board, retrospective software is a prioritization tool. However, the latter takes a broad view of how you’re using your efforts. Retrospectives allow you to visualize how well your team is performing and how you want to improve.
A typical grid has labels describing what you’re currently doing and what you hope to do. For instance, your team might make a list of tasks you’re wasting time on and goals you want to prioritize more. Potential categories are endless, and they depend on the questions your team wants to answer.

Mind maps
Are you hunting high and low for new ideas? Mind maps are a wonderful brainstorming tool to develop out-of-the-box marketing ideas. These diagrams help to break down your strategy into more detailed initiatives.
Oftentimes, when we tease things out in mind map software, we discover trends we might never have noticed. Perhaps, there’s a gap in your strategy, or you’re missing crucial information about customers. Maybe, you’ve committed to too many tasks and need to hire a new person. Visualizing your strategy is a great way to make sure you’re prioritizing the right things.

Org Charts
A well-defined chain of communication is pretty important for internal purposes. Org charts help people understand the structure of your team. Not only does it show your team who is in their sphere of work, but it lets other teams know who to go to for particular requests.
In a marketing department, it’s common for content, outreach, data analytics, and budget to be handled by different people. And the bigger the company, the more people are involved in managing your marketing goals.
An org chart provides a useful reference for how to share information. This is critical when people need updates or approvals before moving forward on a project. With a glance, team members understand the roles of their colleagues. Everyone shares information more efficiently because they know who to include in their communications.

Gantt Charts
Gantt charts present the schedule you expect to follow for a campaign or initiative. They can be as detailed or broad as you’d like. The point is to convey both your timeline and your process, so all teams know what to expect.

Final thoughts
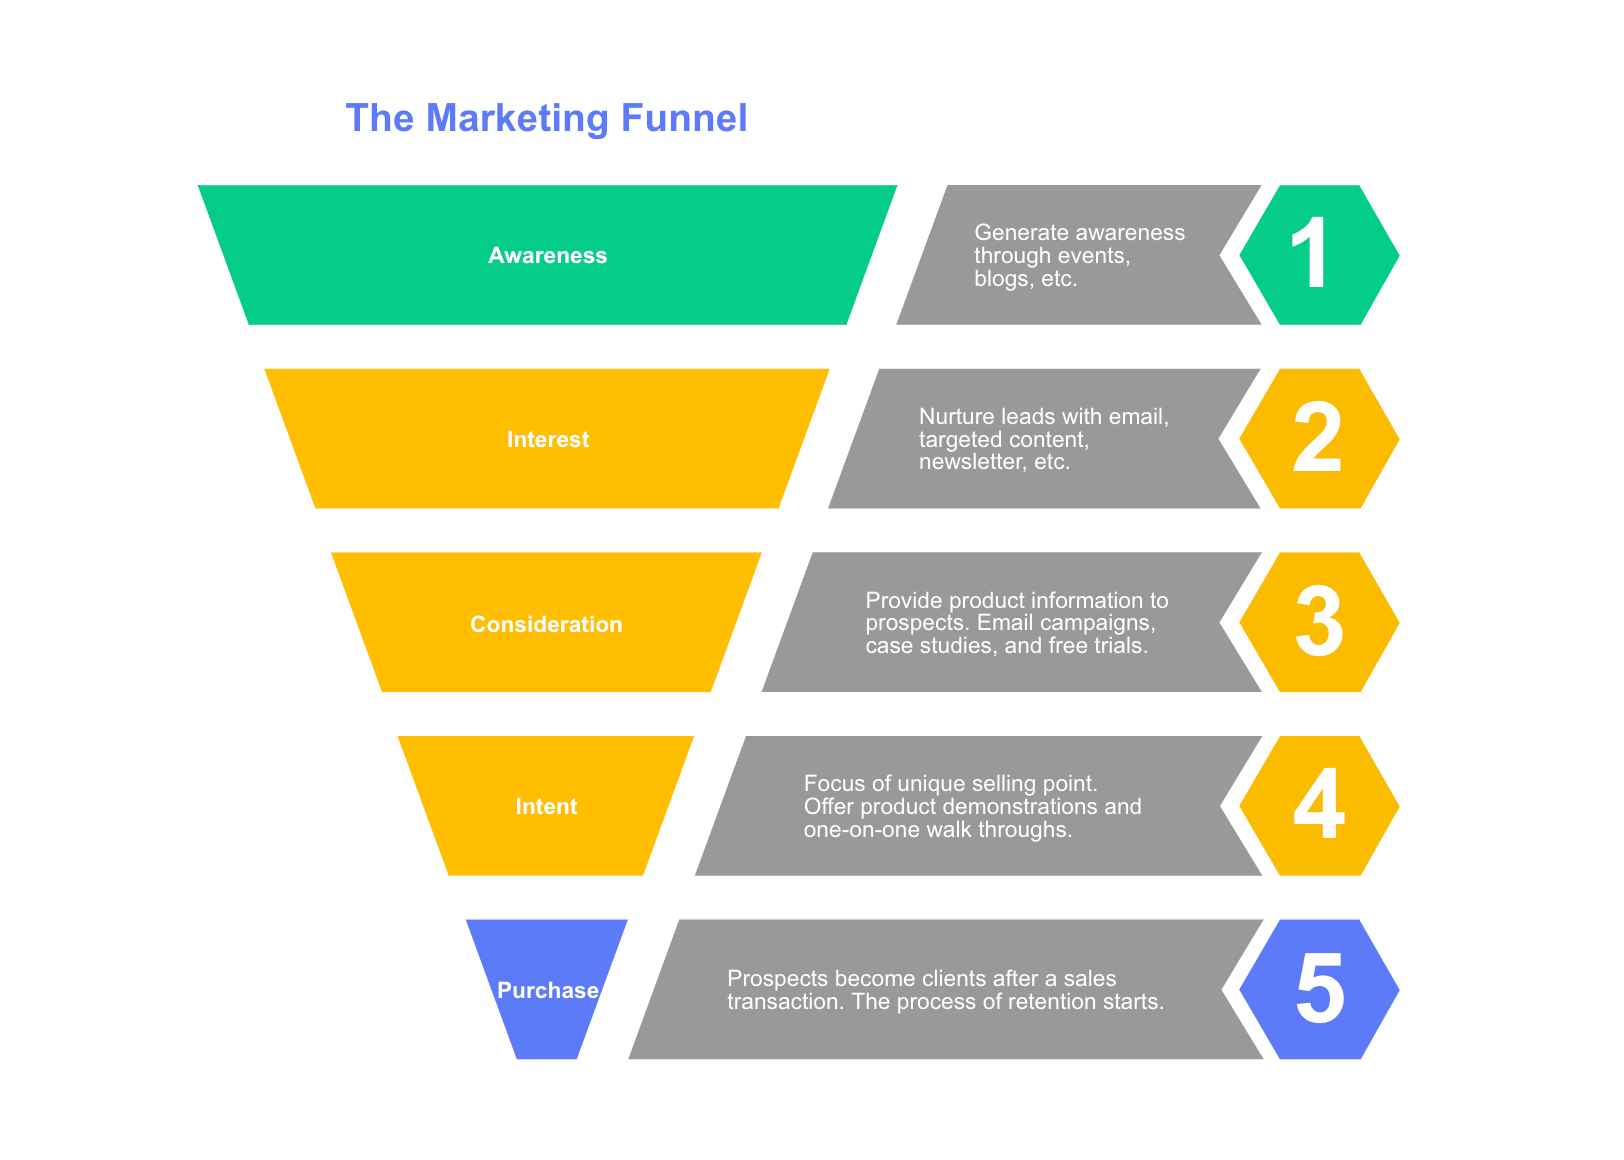
Diagrams can do more than just illustrate what your marketing team does. They can help your team make crucial decisions. Use them to conduct a SWOT Analysis, compare and contrast options with a Venn diagram, or define your sales funnel. There’s a whole world of diagrams ready to explore if you have the right online tool to do it.
Your leadership team will appreciate your commitment to transparency, and other teams will appreciate how easy it is to find the answers they need.
This post was originally published on June 26, 2017, and updated most recently on December 14, 2021.
About Author

![What is process flow? [tips and examples]](https://cdn.nulab.com/learn-wp/app/uploads/2024/11/15203737/blog-process-flow.png)


