
As you’ve hopefully seen, we recently released a new feature in Backlog called Boards. These Kanban-style boards provide a helpful visual of where your tasks are in your workflow for each Backlog project. We had a lot of requests for this feature, and we were really excited when it came time to develop it.
As the team leader in the development of this feature, I want to share our process from kick-off to final release.
Every team is different and has to find a style that works for them. But hopefully, this information will be useful to you and your team when you’re ready to develop your next product.
Here’s what I’ll be covering:
- Project development methodology & tools
- Project kick-off: Determining the scope
- Wireframes & Specifications
- Milestones: Determining the project’s milestones
- Product backlog:
- Milestones + Estimated story points = Burndown charts
Project development methodology & tools
For most projects, our development teams use our own version of Scrum. We work in one-week Sprints to develop the product iteratively and hold regular meetings on Mondays and Wednesdays for reviews and discussions.
For project management and code version control, we naturally use our own tool Backlog.
We also use our collaborative diagramming tool Cacoo. Cacoo helps us create and collaborate on wireframes, UML, workflows, specifications, etc., as text and verbal communication alone are seldom enough. We can also embed these diagrams in Backlog wherever we need. These diagrams help us communicate more clearly and efficiently throughout our projects.
Project kickoff: Determining the scope
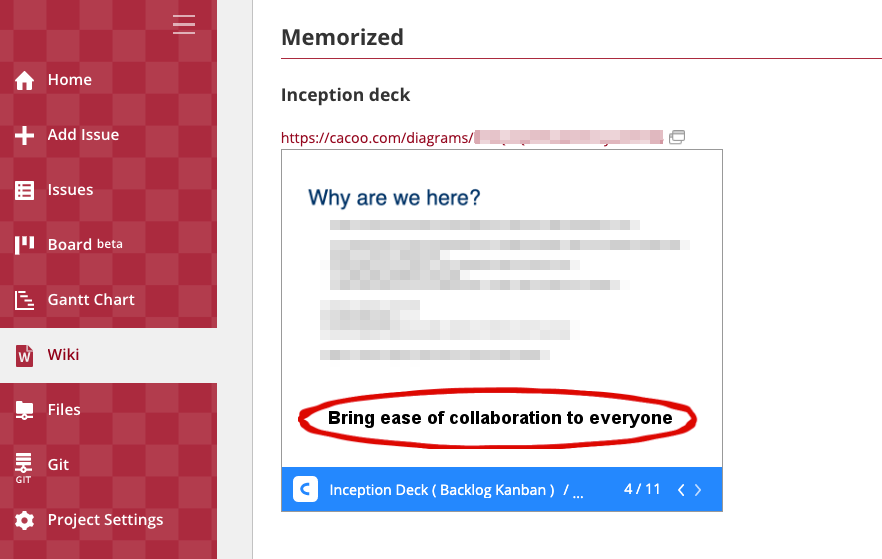
We started off the project with a project inception deck created in Cacoo. We had all team members and internal stakeholders meet to define the project scope, including features, priorities, and constraints.
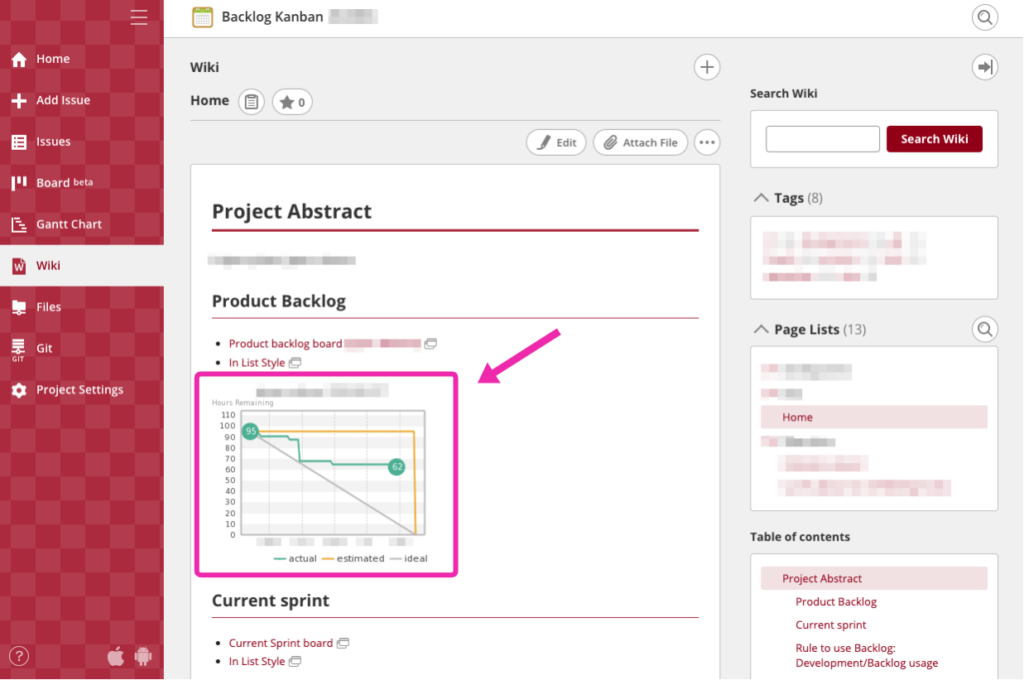
Then, we added the diagram to our Backlog project’s Wiki homepage for easy reference.
Want to learn more about managing your project’s Wiki? Check out our Wiki Guide.
Wireframes: Determining the rough specifications
Next, we created some rough wireframes of the product in Cacoo and discussed them with the team using comments and mentions. After enough feedback, we defined the requirements of our Minimum Viable Product (i.e., MVP)
As with our inception deck, we added this wireframe on our project’s Wiki homepage.
Milestones: Determining the project’s milestones
Next up was setting our project’s milestones.
Since our project was considered complete when the Board feature was released to all Backlog spaces, we designed our major/release milestones around this goal.
Example
| Milestone | End date |
| Alpha release | XXXX – XX – XX |
| Group 1 release | XXXX – XX – XX |
| Group 2 release | XXXX – XX – XX |
The first milestone we set was to release the Alpha version of the Board to our internal Nulab staff. We wanted to test the product internally first to gather feedback and make improvements before releasing anything to the public. Once we were confident in the product’s stability and usefulness, we then planned to release it to other user groups.
Reference: How to set a milestone in Backlog
Product backlog:
At the start of the project, we came up with a list of functions we aimed to have ready at the final release. This list became our product backlog.
Now, it was time to define those tasks.
User stories
Since we follow the Scrum framework, we recorded each item in our product backlog as a user story, e.g., “user can do X,” “user can drag and drop cards,” etc.
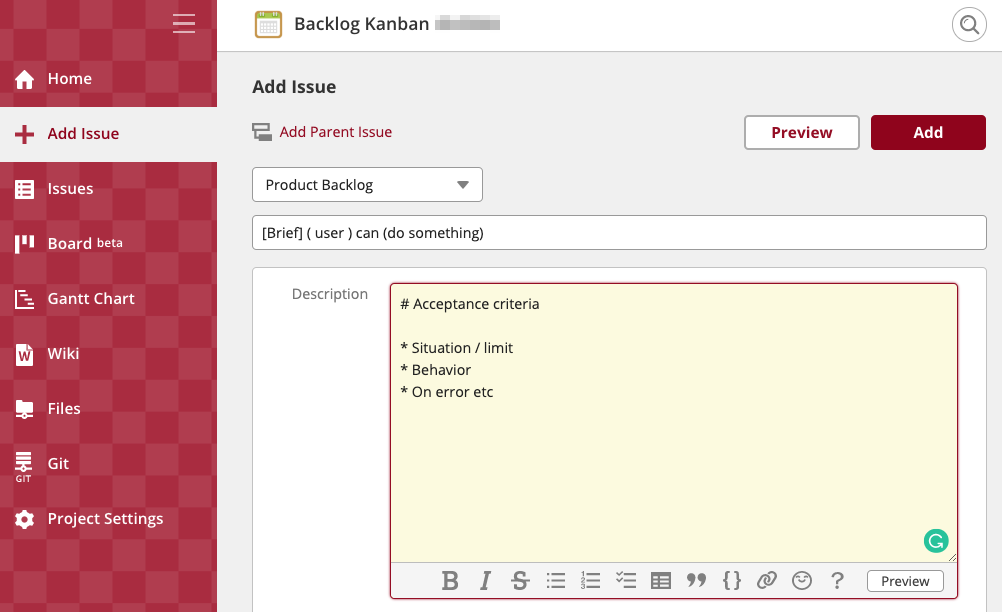
Here is an example of what one of our user stories might look like.
| Subject | [Status Column] Users can see all statuses in the project as side-by-side columns |
| Details | # Acceptance criteria
* The name of the status obtained from the backend API is displayed above the column * The contents of the column can be empty * If there is no common server yet, it is OK if it is running locally. |
| Milestone | Nulab Alpha |
| Estimated time | 3 |
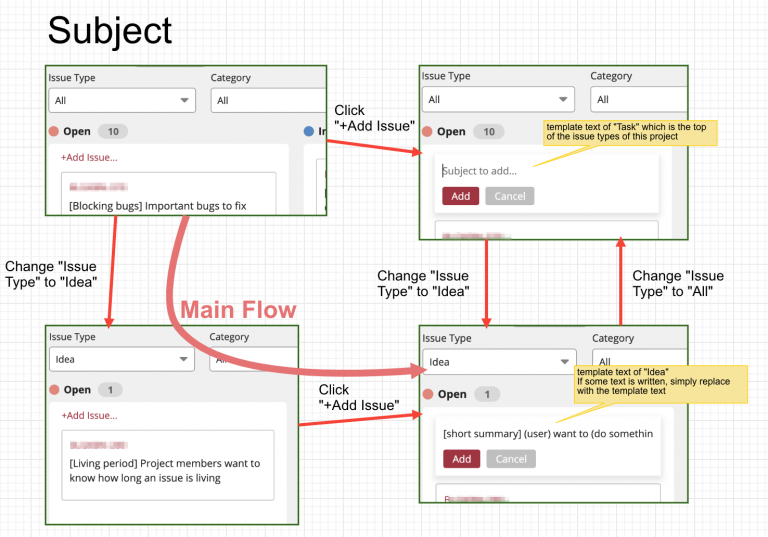
To make writing these stories easy and consistent, we used the issue templates feature, where you can create standardized templates for different issue types, so that it auto-populates the required information to fill.
Issue subject
When creating the issue subject, we decided to add a brief title in square brackets — e.g., [Status Column] in our user story example — at the start of each task. This practice helps us distinguish tasks at a glance and makes it easier to reference them in discussions.
While Backlog automatically assigns a unique key for each task (i.e., BLG-20139), our team finds it simpler to refer to tasks by these brief titles when talking with team members.
Estimating time/effort
For the estimated time in our user story example, the number 3 doesn’t mean 3 hours, but 3 story points. We use story points as a unit of time to roughly estimate each user story.
For example: If task A requires 1 story point of effort, and task B is more difficult, then task B should have more story points, perhaps 2 or 3.
When we add up every story point in the project, the total gives us an idea of the project’s scale. This is also necessary for using the Burndown chart feature in Backlog, which I will discuss later on.
Non-user story tasks
There are other development tasks, besides user-based actions, that we have to manage. These tasks are standardized in a similar format.
Here is an example of what those tasks might look like.
| Subject | [dev environment] Developers can easily check the created function on a common server |
| Details | # Acceptance criteria
* The board is running on the common server * Jenkins automatically deploys to the common server when merging into the develop branch |
| Milestone | Nulab Alpha |
| Estimated time | 15 |
For this project, we estimated our story points a little higher than usual because all of the systems — including infrastructure and middleware — were new. We knew that running the development server alone would take considerable work.
Prioritizing the product backlog/user stories
When organizing our product backlog, we always want to have all user stories and tasks listed in order of priority with the most important tasks at the top. The ordering of the product backlog is essential as developers work independently, starting from the top of the list.
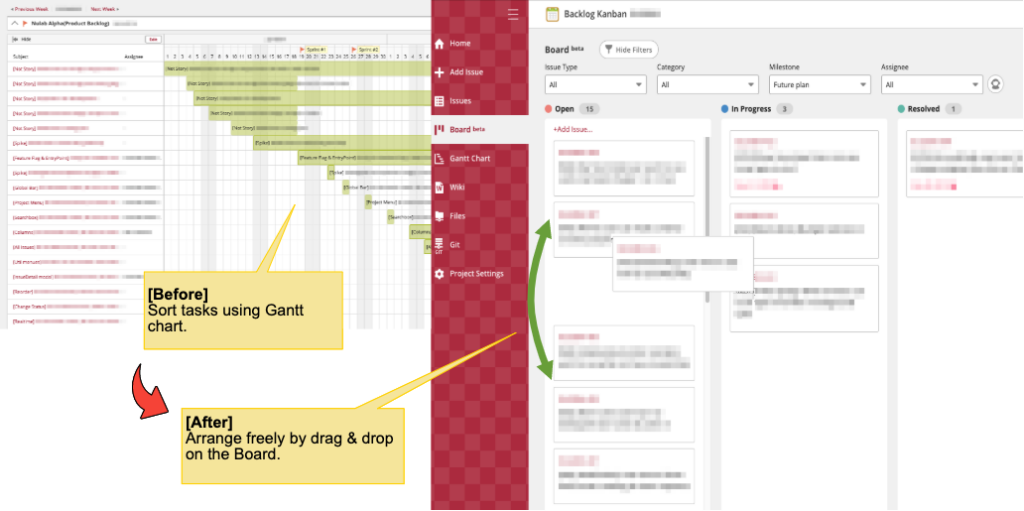
Unfortunately, before we had the Board feature, we didn’t have a function in Backlog for arranging tasks in this way. But we had a workaround: I entered a fake start date for all tasks and arranged them accordingly on our project’s Gantt chart. The earlier the start date, the higher on the Gantt chart the task would appear, thus giving it a higher priority.
Now that we have released the Board feature — which allows you to prioritize your task list visually, — I wouldn’t recommend others follow the workaround. Because we did it this way, the actual start dates of the tasks were different from the entered dates, and that could have drawbacks for some teams.
After the Alpha version of the Board was released, we stopped using this tricky Gantt chart hack and started using our project’s Board feature to maintain the product backlog.
Using Gantt charts in Backlog
Something to keep in mind when you’re using Backlog is that tasks without start/end dates will not show up on your project’s Gantt chart. However, if you create a task (that has no start/end dates) with an assigned milestone, it will show up at the milestone’s end date on the Gantt chart.
Then, when you have the task’s start/end dates, you can simply drag them to that part of the chart. This is convenient for managing tasks with milestones even when you’re not sure of their start/end dates yet.
Milestones + Estimated story points = Burndown charts!
An auto-generated Burndown chart will appear on your project homepage when you have the following information:
- Milestone set with start and end dates
- Tasks assigned to the milestone
- Estimated time/story points for each task
Reference: How to enable Burndown charts in your project

Burndown charts are a great way to visualize your work progress in relation to milestones. The line graph — which represents your remaining time or story points — “burns down” as tasks are closed, thus showing whether your team’s work is on track to meet the milestone deadline.
Using Burndown charts in Backlog
The burn line will automatically update when the total amount of work increases or decreases due to new story point estimates or new tasks being added.
In addition, Backlog’s Burndown charts are easily embeddable. Just right-click and copy the image URL of any Burndown chart in Backlog, and you can paste it to that project’s Wiki or other web services*.
*The image will only show for project members who are logged in to their accounts.
Stakeholders and other team members can quickly assess the progress of the project by looking at the Burndown chart. Every five minutes, the chart automatically updates.
Note: If your Burndown chart does not seem to be updating, try clearing your browser cache of images. Your browser could be loading an older version by accident.
To be continued…
So far, I have shared about our development methodology, how we prioritize user stories in Backlog, and how we use Gantt and Burndown charts to track project progress.
Please check out Part 2 where I will share about our Sprint workflow and more!
About Author


