See all causes and factors at a glance
Find the root cause of issues
Brainstorm solutions and anticipate effects
Cacoo makes it easy to create fishbone diagrams online

Use fishbone diagram templates to get to work right away
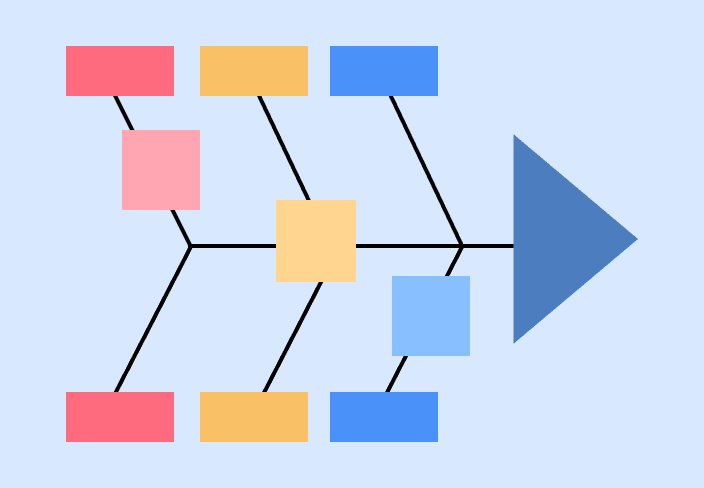
The Fishbone Diagram — also known as a "cause and effect diagram" or an Ishikawa Diagram after its inventor, Kaoru Ishikawa — helps you quickly find the root causes of problems and brainstorm solutions.
- Fishbone diagram templates
- Easy-to-use interface
- Shareable diagrams

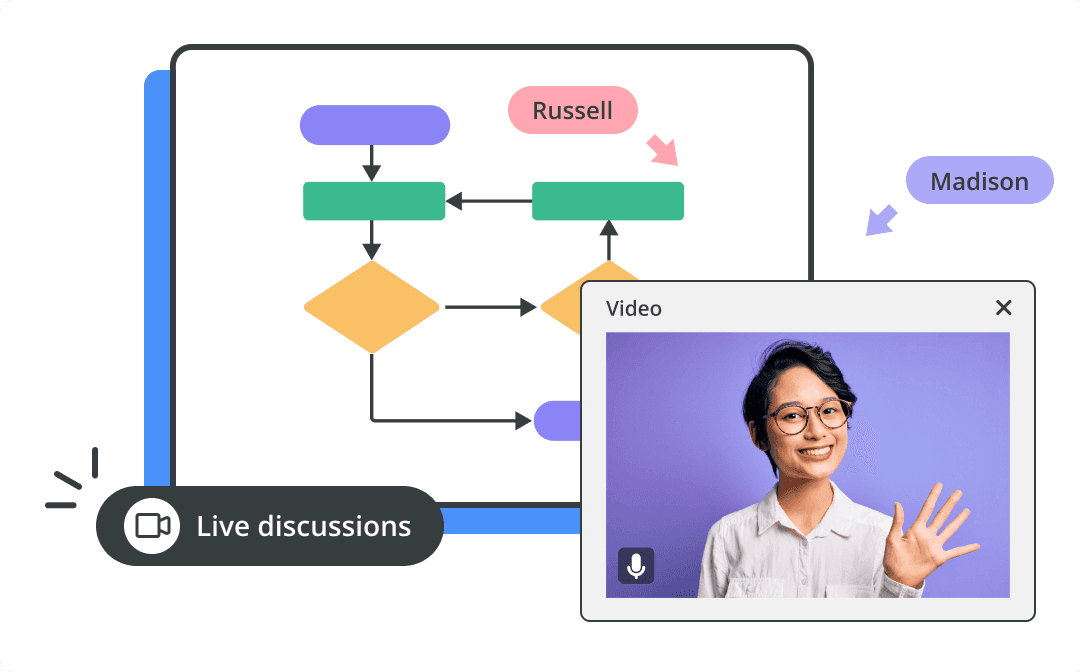
Collaborate with anyone in real-time
Create, edit, and chat about your fishbone diagrams, together.
- Multi-user editing
- In-app video & chat
- Comments on boards
- Activity notifications

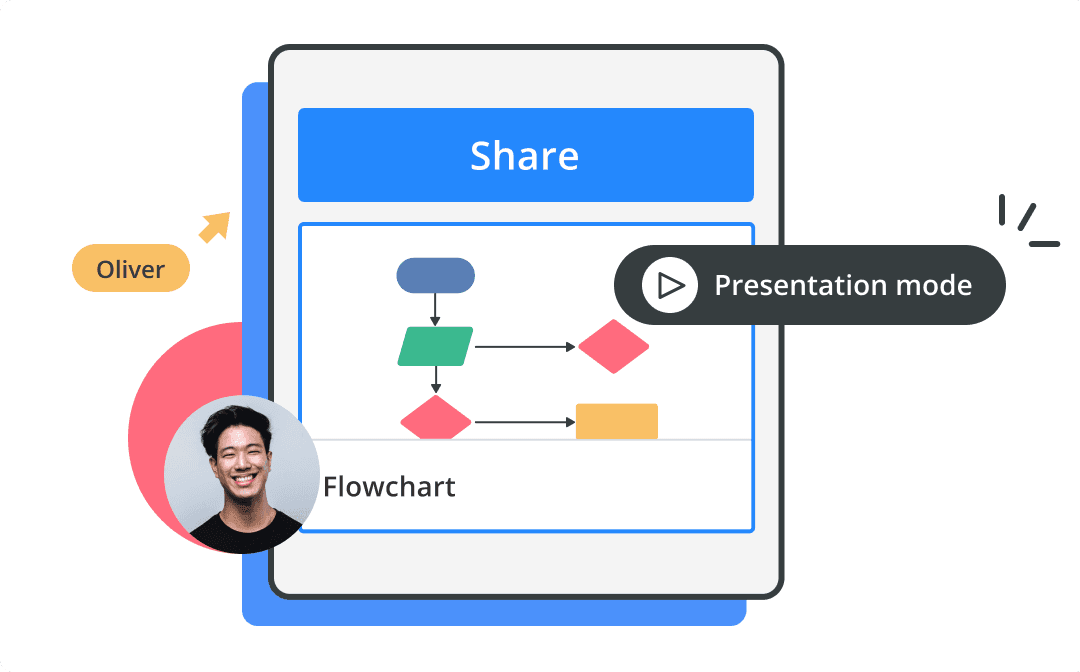
Present and share your work
Share your fishbone diagrams with others.
- Presentation mode
- Screen Share
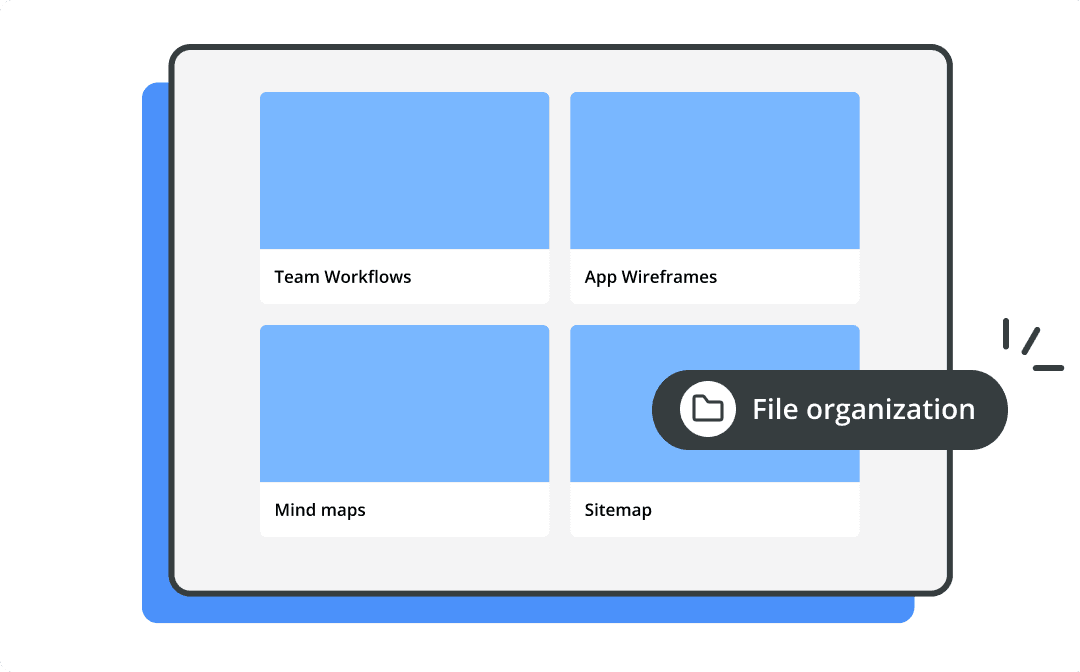
- Shared folders
- Public board links
- Exporting (SVG, PDF, and more)
- Embeddable board viewer

Keep files organized and secure
Keep fishbone diagrams organized with shared project folders.
- Team management
- Security settings
- Groups for easy access
- Guest access
How to make a fishbone diagram
Gather information from each touchpoint
You'll need to understand steps, key decisions, resources, documents, and people needed from start to finish.
Select a template or start a blank board
Plot out your start and end point, then fill in everything in between ensuring each touchpoint is accounted for.
Assess your diagram to find the root cause of effects
Start from the unwanted effect you're experiencing. Determine what role (if any) each factor you pinpointed plays in contributing to that outcome.
Brainstorm solutions
Once you understand the contributing factors, brainstorm solutions. Then try plugging them in to see if they solve the issue completely, partially solve it, or create new issues.
Collaborate and share
Get feedback from others, make any necessary edits, and share with the right people once it's finalized.
Learn more about fishbone diagrams
Use our fishbone diagram templates to get started
Or create your own from scratch.

