PERT chart maker for visual project planning and on-time delivery
Plan projects clearly and track dependencies with Cacoo’s easy-to-use PERT charts
What is a PERT chart?
Try it free nowA PERT chart (Program Evaluation Review Technique) is a probabilistic project scheduling tool used to visualize task sequences, estimate durations using three-point estimation (optimistic, most likely, pessimistic), and determine the critical path. It’s especially useful in projects with uncertain timelines or complex task dependencies.

Why use a PERT chart maker?
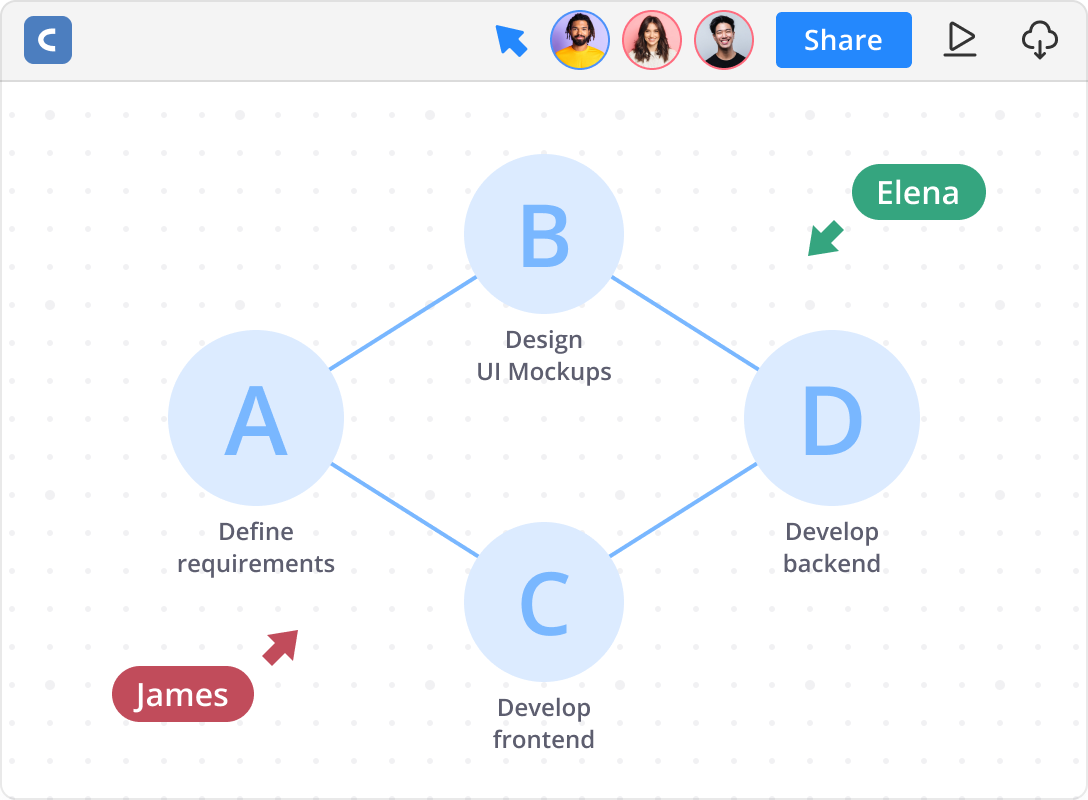
Using a PERT chart maker like Cacoo makes it easy to map out complex projects. You can identify the critical path, apply accurate time estimates, and structure task dependencies all within a shareable diagram that updates in real time.
Who uses PERT charts?
PERT charts are ideal for anyone managing multi-step projects with tight deadlines and sequential task dependencies. Teams that benefit include:
Visualize timelines, identify dependencies, and manage the critical path to keep projects on track.
Map development sequences to keep interdependent tasks progressing on schedule.
Oversee workflows across departments and minimize delays from task dependencies.
Manage sequential phases of complex builds and maintain alignment across teams.
Structure product roadmaps and guide cross-functional efforts from planning to launch.
PERT vs. Gantt vs. CPM
Try it free nowWhen managing complex projects, choosing the right visual planning method is key. PERT charts, Gantt charts, and the Critical Path Method (CPM) each serve different needs depending on how your project is structured.
PERT (Program Evaluation Review Technique)
- Best for projects with uncertainty or tasks that must be completed in a specific sequence.
- Estimates task durations using time ranges (optimistic, most likely, pessimistic) for each task.
- Visualizes task flow and highlights project logic and dependencies.
- Commonly used in research, product development, and engineering projects.
Gantt charts
- Best for tracking deadlines, task durations, and team assignments in a visual timeline.
- Clearly shows when each task starts and ends, including overlapping or concurrent tasks.
- Useful for communicating progress and keeping stakeholders aligned.
- Ideal for marketing campaigns, content calendars, or small-to-medium-sized projects.
CPM (Critical Path Method)
- Best for identifying which tasks directly affect the project’s completion date.
- Highlights the longest sequence of dependent tasks—the “critical path.”
- Helps optimize time and resources by showing which tasks can be delayed without affecting the overall schedule.
- Often used in construction, manufacturing, and other deadline-driven fields.
When to use each
- Use PERT when your project has uncertainty and you need flexible time estimates.
- Use Gantt when you want a straightforward view of task timing and progress.
- Use CPM when you need to streamline the schedule and manage time-critical tasks.
Why teams use PERT charts
Visualize milestones and plan your team’s workload with greater accuracy.
Coordinate tasks to prevent delays and keep everyone aligned.
Anticipate resource needs in advance and assign tools and teams accordingly.
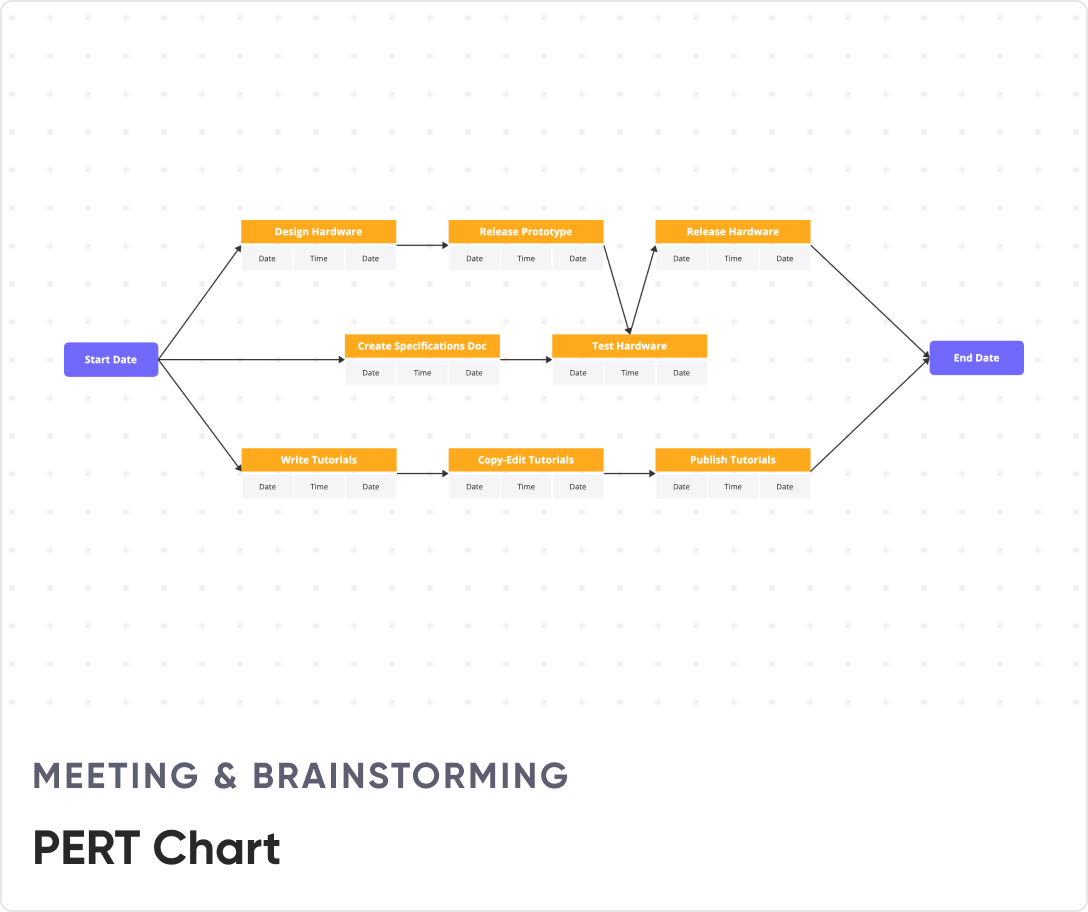
PERT chart templates to get started
Get a head start with pre-built diagrams, or create your own from scratch
Integrate with your favorite apps
Connect Nulab products with each other and with your favorite tools to build a seamless, end-to-end workflow
Try Cacoo for PERT charts today
Plan with precision
Visualize task timelines and dependencies in Cacoo. Try Cacoo free — full access, no commitment.
Try it freeWant a tailored walkthrough?
Schedule a quick call and we’ll help you streamline your project planning with Cacoo.
Contact salesTRUSTED BY OVER 4 MILLION USERS WORLDWIDE


How teams use Cacoo to visualize timelines and keep projects on track
Project managers and teams across industries use Cacoo to map dependencies, estimate timelines, and manage complex workflows with confidence. Here’s how Cacoo supports smarter planning and execution.
Read more"Other tools require you to specify the canvas size, but Cacoo's canvas is large enough that it does not limit our imagination."
Start making PERT charts with Cacoo today
Plan smarter with visual timelines and task dependencies that keep your projects on track